-
スクレイピング対象
都道府県データランキング(https://uub.jp/)
では、各都道府県の基本データ、市区町村のデータ、政令指定都市など指定都市のデータ、人口、面積、人口密度、公式HPなど公式広報メディア、市区町村変遷情報、ランキングデータ、雑学、地名コレクション、都道府県ランキング、新型コロナウイルス情報など多彩なデータがあり、データベース検索機能や地理好きが集まる掲示板もありとても充実したサイトである。
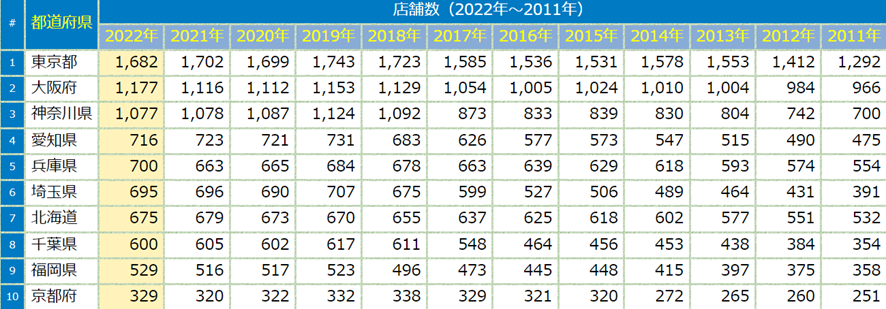
このうち、本レポートではローソンの都道府県ランキングに注目してスクレイピングを実施した。
上記の図のような都道府県ごとの様々なデータランキングがある。
- 使用したpython ライブラリ
ローソンのテーブルを取得するために、本レポートではpandasのread_html関数を使用した。
・read_html関数について
pandas.read_html(URL、任意の引数)などと入力するとそのロケーションのhtmlファイル読み込み、ファイル中のtableタグの記述をスクレイピングする。
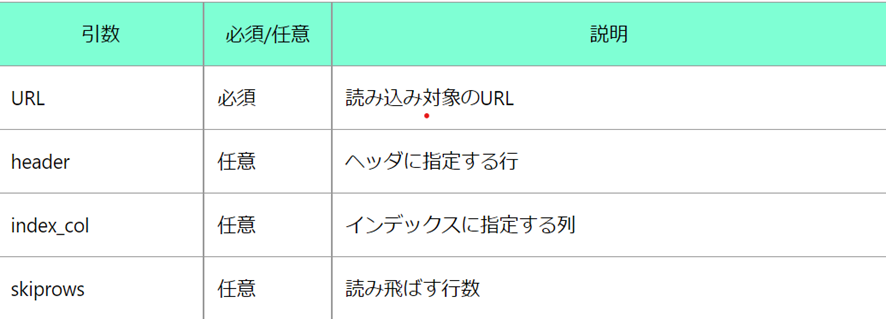
主な引数は以下の表のとおりである。

read_html関数を使う際に用いる任意の引数をまとめた表
・主な活用場面
・統計情報を取得し、マーケットリサーチに活用。
・他社の情報を取得し、競合分析に活用。
・株価情報を取得し、トレンドを把握し、分析に活用。
主にこのような場面が上げられる。
- スクレイピングに使用したコードについて
df_all = pd.read_html('https://uub.jp/pdr/m/lawson.html') ローソンのデータを読み取る
df_test.columns = df_test.iloc[1] データから1行目を抽出
df_test.rename(df_test.iloc[:,1], inplace=True) データから1列目を抽出
df_test.drop(df_test.index[[0, 49, 50]], inplace=True) 0から50の行を抽出
df_test.drop(df_test.columns[[0, 1]], axis=1, inplace=True) 0列目と1列目の行を抽出
df_test 出力
上記のコードで、pandasのメソッドでページ全体の表データを取得する。
df_cholopleth = copy.copy(df_all[5]) ランキング化したデータの複合オブジェクトを格納
df_cholopleth.columns = df_cholopleth.iloc[1] ランキング化したデータの1行目を列とする。
df_cholopleth.drop(df_cholopleth.index[[0, 1, 49, 50]], inplace=True) 0行目を列名とし、1行目から50行目までを抽出。
df_cholopleth.drop(df_cholopleth.columns[[0]], axis=1, inplace=True) 0列目の行を抽出
上記のコードでマップ描画用の前処理を行う。
df_cholopleth['2022年'] = df_cholopleth['2022年'].astype('int')
上記のコードでオブジェクト型に整理されていたのを数値型に変換。
choropleth_map = folium.Map(location = [35.68, 139.77], zoom_start=7)
上記のコードで表示する中心座標、zoom_stratで縮尺を指定する。
folium.Choropleth(
geo_data = geojson, データを指定
name = "choropleth", 地図のタイトル
data = df_cholopleth, 統計データの指定
columns = ['都道府県', '2022年'], 統計データのうち使用するカラム
key_on = 'feature.properties.name', 統計データとの結合Keyとなる項目
fill_color = 'YlOrRd', 色分けの指定
threshold_scale=[0, 100, 500, 1000, 3000], 階級区分の指定
fill_opacity = 0.7, ポリゴン領域の透過度指定
line_opacity = 0.2, ラインの透過度指定
legend_name = 'ローソン店舗数', ).add_to(choropleth_map) タイトル指定
choropleth_map マップを表示
5. 作成したスクレイピングの応用の可能性

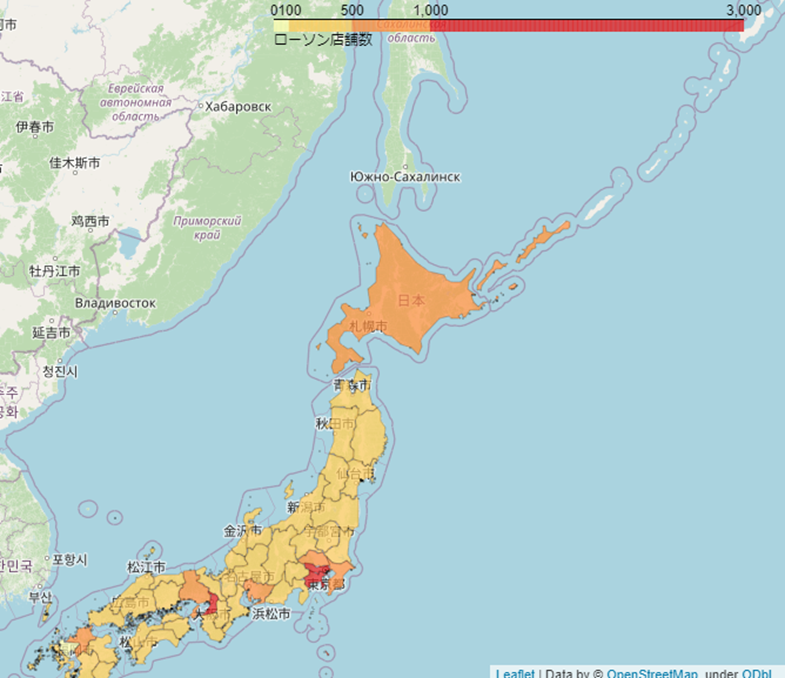
各都道府県のローソンの店舗数を現したコロプレスマップ
栄えている都市ほどローソンの店舗数は多いと言える。
コレロマップの利点は、おのおのの統計区の広さがほぼ同じ字の場合は分布の状況がよく表されるので 、国民所得や人口密度など統計数値など地域ごとに数値を比較し可視化する際に利用することができる。
コロプレスマップの欠点は、特定の色の占める面積に左右される事である。上記の図のように、北海道は面積が広い分店舗数が多いので色が濃くなっているが、面積に対しての店舗数で考えてみればまた違った結果が表示されると思われる。
