fluentdについて
概要
fluentdとは、
fluentd は ログ集約ソフトウェア である
今回はdockerを用いて運用の実験を行なった。
検証1. fluentdの動作確認
目標
アプリケーションサーバとfluentdサーバの2つを使ってfluentdの機能を確かめる。
ファイル構造
|-- bottle_app
|      |-- app
|           |-- main.py   <- メイン
|           |-- bottle.py
|           |-- views      <- htmlファイル群
|
|-- fluentd
       |-- config
            |-- fluent.conf
> アプリケーションサーバ
pythonのbottleを用いて簡単なwebサーバを作成。
main.py
# coding: utf-8
from bottle import template, route, run, request
import urllib

# htmlファイルを返す関数
@route('/')
def login():
    print("test")
    return template('text_login')

# postされた情報を加えたhtmlファイルを返す関数
@route('/text_check', method='post')
def check():
    username = request.forms.get('username')
    email = request.forms.get('email')

    return template('text_check.html', username=username, email=email)

run(host='0.0.0.0', port=8080, debug=True)
実行
docker run -it --rm --name my-app -v "$PWD":/usr/src/myapp -w /usr/src/myapp -p 8080:8080 --log-driver=fluentd --log-opt fluentd-address=localhost:24220 --log-opt tag="docker.{{.Name}}" python:3 python main.py
> fluentdサーバ
fluentdを利用する場合は、confファイルを作成する必要がある
fluent.conf
<source>
  @type forward
  port 24220
</source>

<match docker.**>
  @type stdout
</match>
実行
docker run -p 24220:24220 -p 24220:24220/udp -v /tmp/fluentd:/fluentd/etc -e FLUENTD_CONF=fluent.conf --name=fluentd --rm fluent/fluentd
実行結果
curlを実行したとき
$ curl http://localhost:8080/
<!DOCTYPE html>
<html lang="en">
<head>
    <meta charset="UTF-8">
</head>
<body>
    <h1>メールアドレスと名前を送信してください</h1>
        <form method="post" enctype="application/x-www-form-urlencoded" action="/text_check">
            <input placeholder="名前" name="username" type="text"/>
            <input placeholder="メール" name="email" type="text"/>
            <input value="送信" type="submit"/>
        </form>
</body>
</html>
fluentdの出力例
2019-05-16 01:24:18.000000000 +0000 docker.my-app: {"container_name":"/my-app","source":"stdout","log":"172.17.0.1 - - [16/May/2019 01:24:18] \"GET / HTTP/1.1\" 200 483\r","container_id":"b5d1b68d9515f8b386ef798a97d30a3d8c1d74e04796965c3bbadf3f490d2d23"}
検証2. 実用的な運用モデルの作成と実施
目標
この例では、webサーバのログを取得し可視化する。
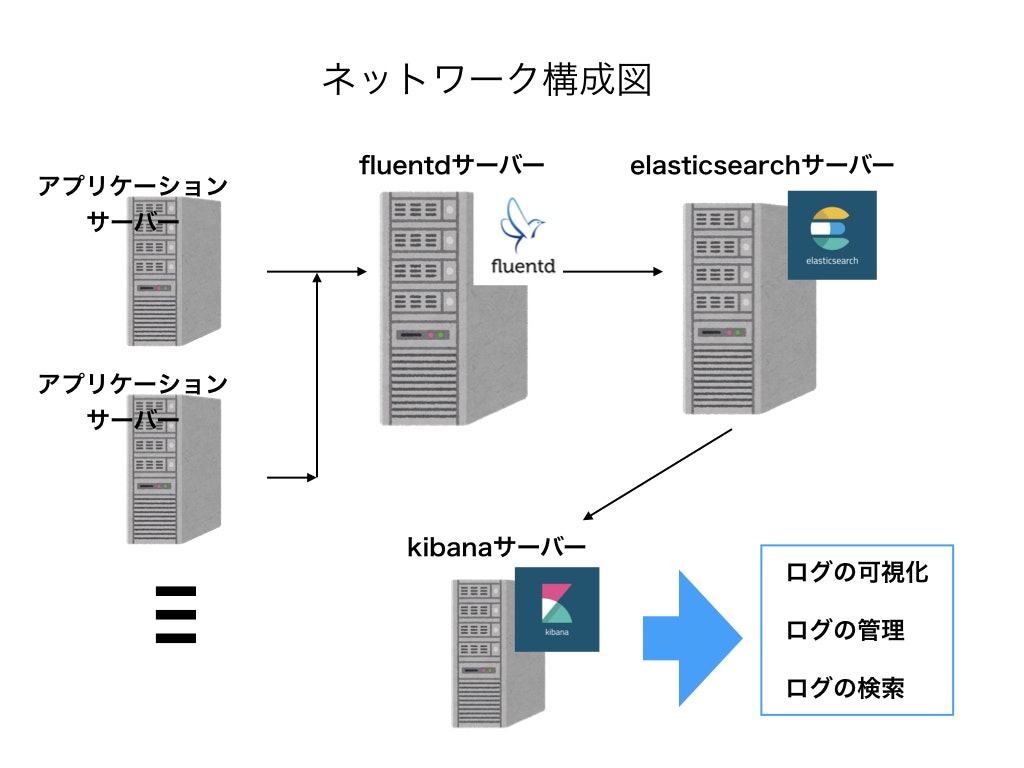
作成するサーバは4つ。
- webサーバ(pythonのbottleを使って実現)
- ログ集積サーバ(fluentdを使用)
- elasticsearchサーバ
- kibanaサーバ
具体的には以下のネットワーク構成図とファイル構造を参照
ファイル構造
|-- bottle_app
|      |-- app
|      |    |-- main.py   <- メイン
|      |    |-- views      <- htmlファイル群
|      |
|      |-- Dockerfile
|
|-- fluentd
|      |-- config
|      |    |-- fluent.conf
|      |
|      |-- Dockerfile
|
|-- elasticsearch
|      |-- Dockerfile
|
|-- kibana
|      |-- Dockerfile
|
|-- docker-compose.yml
ネットワーク構成図
各コード
- docker-compose.yml
version: "3.7"

services:
  bottle_app:
    build: ./bottle_app
    volumes:
      - ./bottle_app/app:/workspace
    ports:
      - "8080:8080"
    logging:
      driver: "fluentd"
      options:
        fluentd-address: "localhost:24220"
        tag: "docker.{{.Name}}"
    depends_on:
      - fluentd

  fluentd:
    build: ./fluentd
    volumes:
      - ./fluentd/config:/fluentd/etc
    ports:
      - "24220:24220"
      - "24220:24220/udp"
    depends_on:
      - elasticsearch
      - kibana

  elasticsearch:
    build: ./elasticsearch
    ports:
      - "9200:9200"
      - "9300:9300"
    environment:
      - discovery.type=single-node
      - "ES_JAVA_OPTS=-Xms512m -Xmx512m"
    ulimits:
      memlock:
        soft: -1
        hard: -1

  kibana:
    build: ./kibana
    ports:
      - "5601:5601"
-
bottle_app/app/main.py
1.と同様のプログラム -
bottle_app/Dockerfile
(注意)"-u"オプションを追加すると標準出力がバッファーに溜まることない。
FROM python:3

RUN pip install bottle

WORKDIR /workspace
CMD python -u main.py
- fluentd/config/fluent.conf
elasticsearchへ出力する必要があるのでのパートを変更。
<source>
  @type forward
  port 24220
</source>

<match docker.**>
  @type elasticsearch
  host elasticsearch
  port 9200
  type_name bottle_app
  logstash_format true
</match>
- fluentd/Dockerfile
elasticsearchとの接続のためにプラグインをインストールする必要がある。
FROM fluent/fluentd:v1.3.2-1.0

RUN gem install fluent-plugin-elasticsearch
- elasticsearch/Dockerfile
FROM elasticsearch:6.7.1
- kibana/Dockerfile
FROM kibana:6.7.1
実行結果
kibanaで表示されたアクセスログ
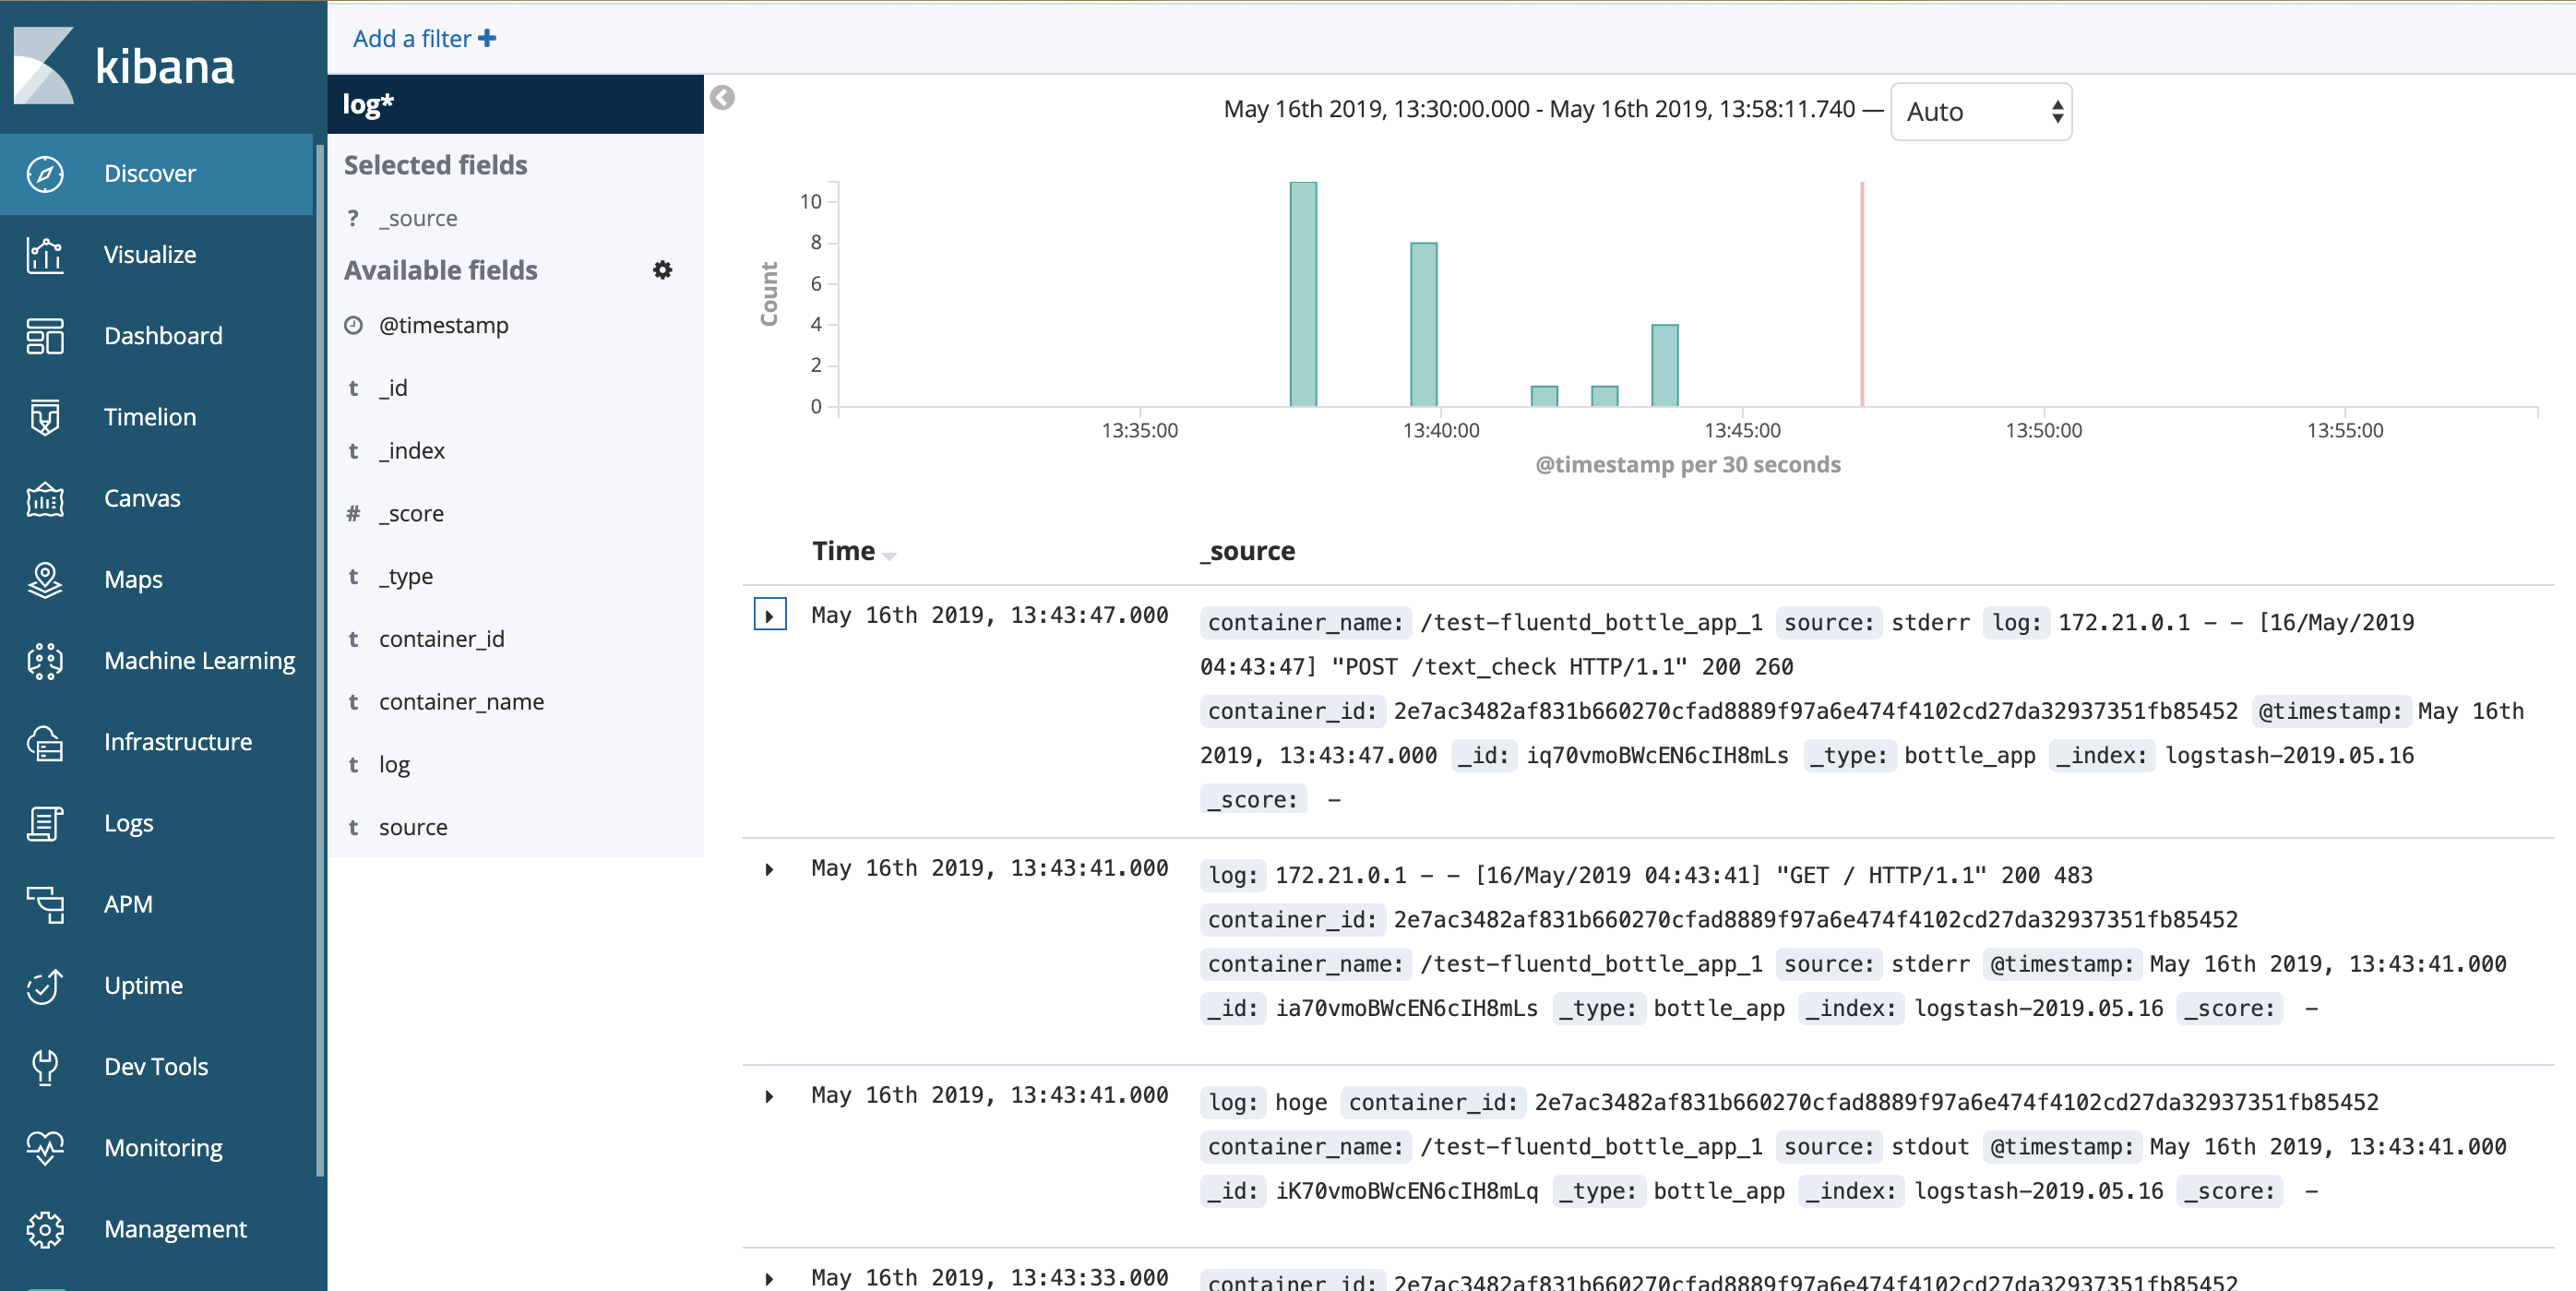
棒グラフが作成され、時間帯別のアクセス数が可視化されている。
また、ログの検索も可能であるからログの分析も容易になっている。
fluent.confの設定について
- source
-
@type: inputしたいソースに対応するプラグインを指定。
- http: httpのエンドポイントとしてFluentdがリクエストを受け取れるようにする
- forward: tcpのエンドポイントとしてFluentdがリクエストを受け取れるようにする
-
port: 接続するポートを指定
- match
-
@type: イベントをタグ指定してoutputプラグインを指定。
- 標準的に使用できるプラグイン: file, forward
- 外部のプラグインを利用(今回はelasticsearchを利用)
-
host: outputする先
-
port: 接続するポートを指定
-
type_name: kibanaで表示するときのログの名前
(注意)elasticsearchのプラグインを利用する場合
- logstash_format: logstashに合う形に整形
参考サイト
[1]Docker初心者が、Nginxのログを fluentd + elasticsearch + kibana で可視化してみた
[2]Dockerのlogging driver: それぞれの特徴と使いどころ(json-file, syslog, journald, fluentd)
[3]Fluentdのインストールとconfigについて
[4]Fluent::Plugin::Elasticsearch