計算結果を見やすいために、通常図の中に横、また縦の補助線を描きます。
一般的なやり方は、例えば y = 0 の横線を描くためには、x = [xmin, xmax], y = [0, 0] リストを作成して描きます。
尚、matplotlib では、専有の関数があります、hlines (横線)、 vlines (縦線)。これを使用して、簡単に何本の補助線でも描けます。以下のサンプルをご参照ください。
参考:plt.hlines([value1, value2, ...], xmin, xmax, linestyle="dashed")
value1, value2 は、横線を描く際の y の値に相当します。
hlines.py
import numpy as np
import matplotlib.pyplot as plt
dx = 0.1
xmin, xmax = -3, 3
x = np.arange(xmin, xmax+dx, dx)
y = np.sin(x)
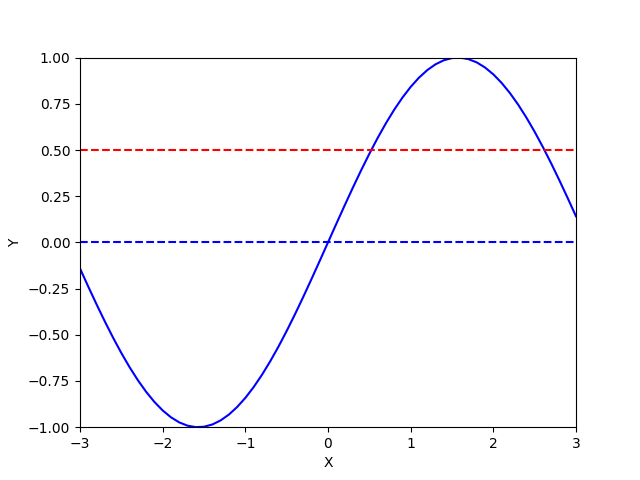
p = plt.plot(x, y, "blue", linestyle='solid')
p = plt.hlines([0], xmin, xmax, "blue", linestyles='dashed') # hlines
p = plt.plot([xmin, xmax],[0.5, 0.5], "red", linestyle='dashed') # normal way
p = plt.xlim(xmin, xmax)
p = plt.ylim(-1, 1)
p = plt.xlabel('X')
p = plt.ylabel('Y')
plt.show(p)