Profiler とは?
- Window > Analysis > Profiler を選択すると開くことができる

- Profile Analyzer
- Unity の Profiler を補助するツール
- 1フレームずつのデータを確認しなければならないが、 複数フレームにまたがったCPU処理を見ることができる
- Memory Profiler
- メモリ情報をスナップショットファイルとして保存可能
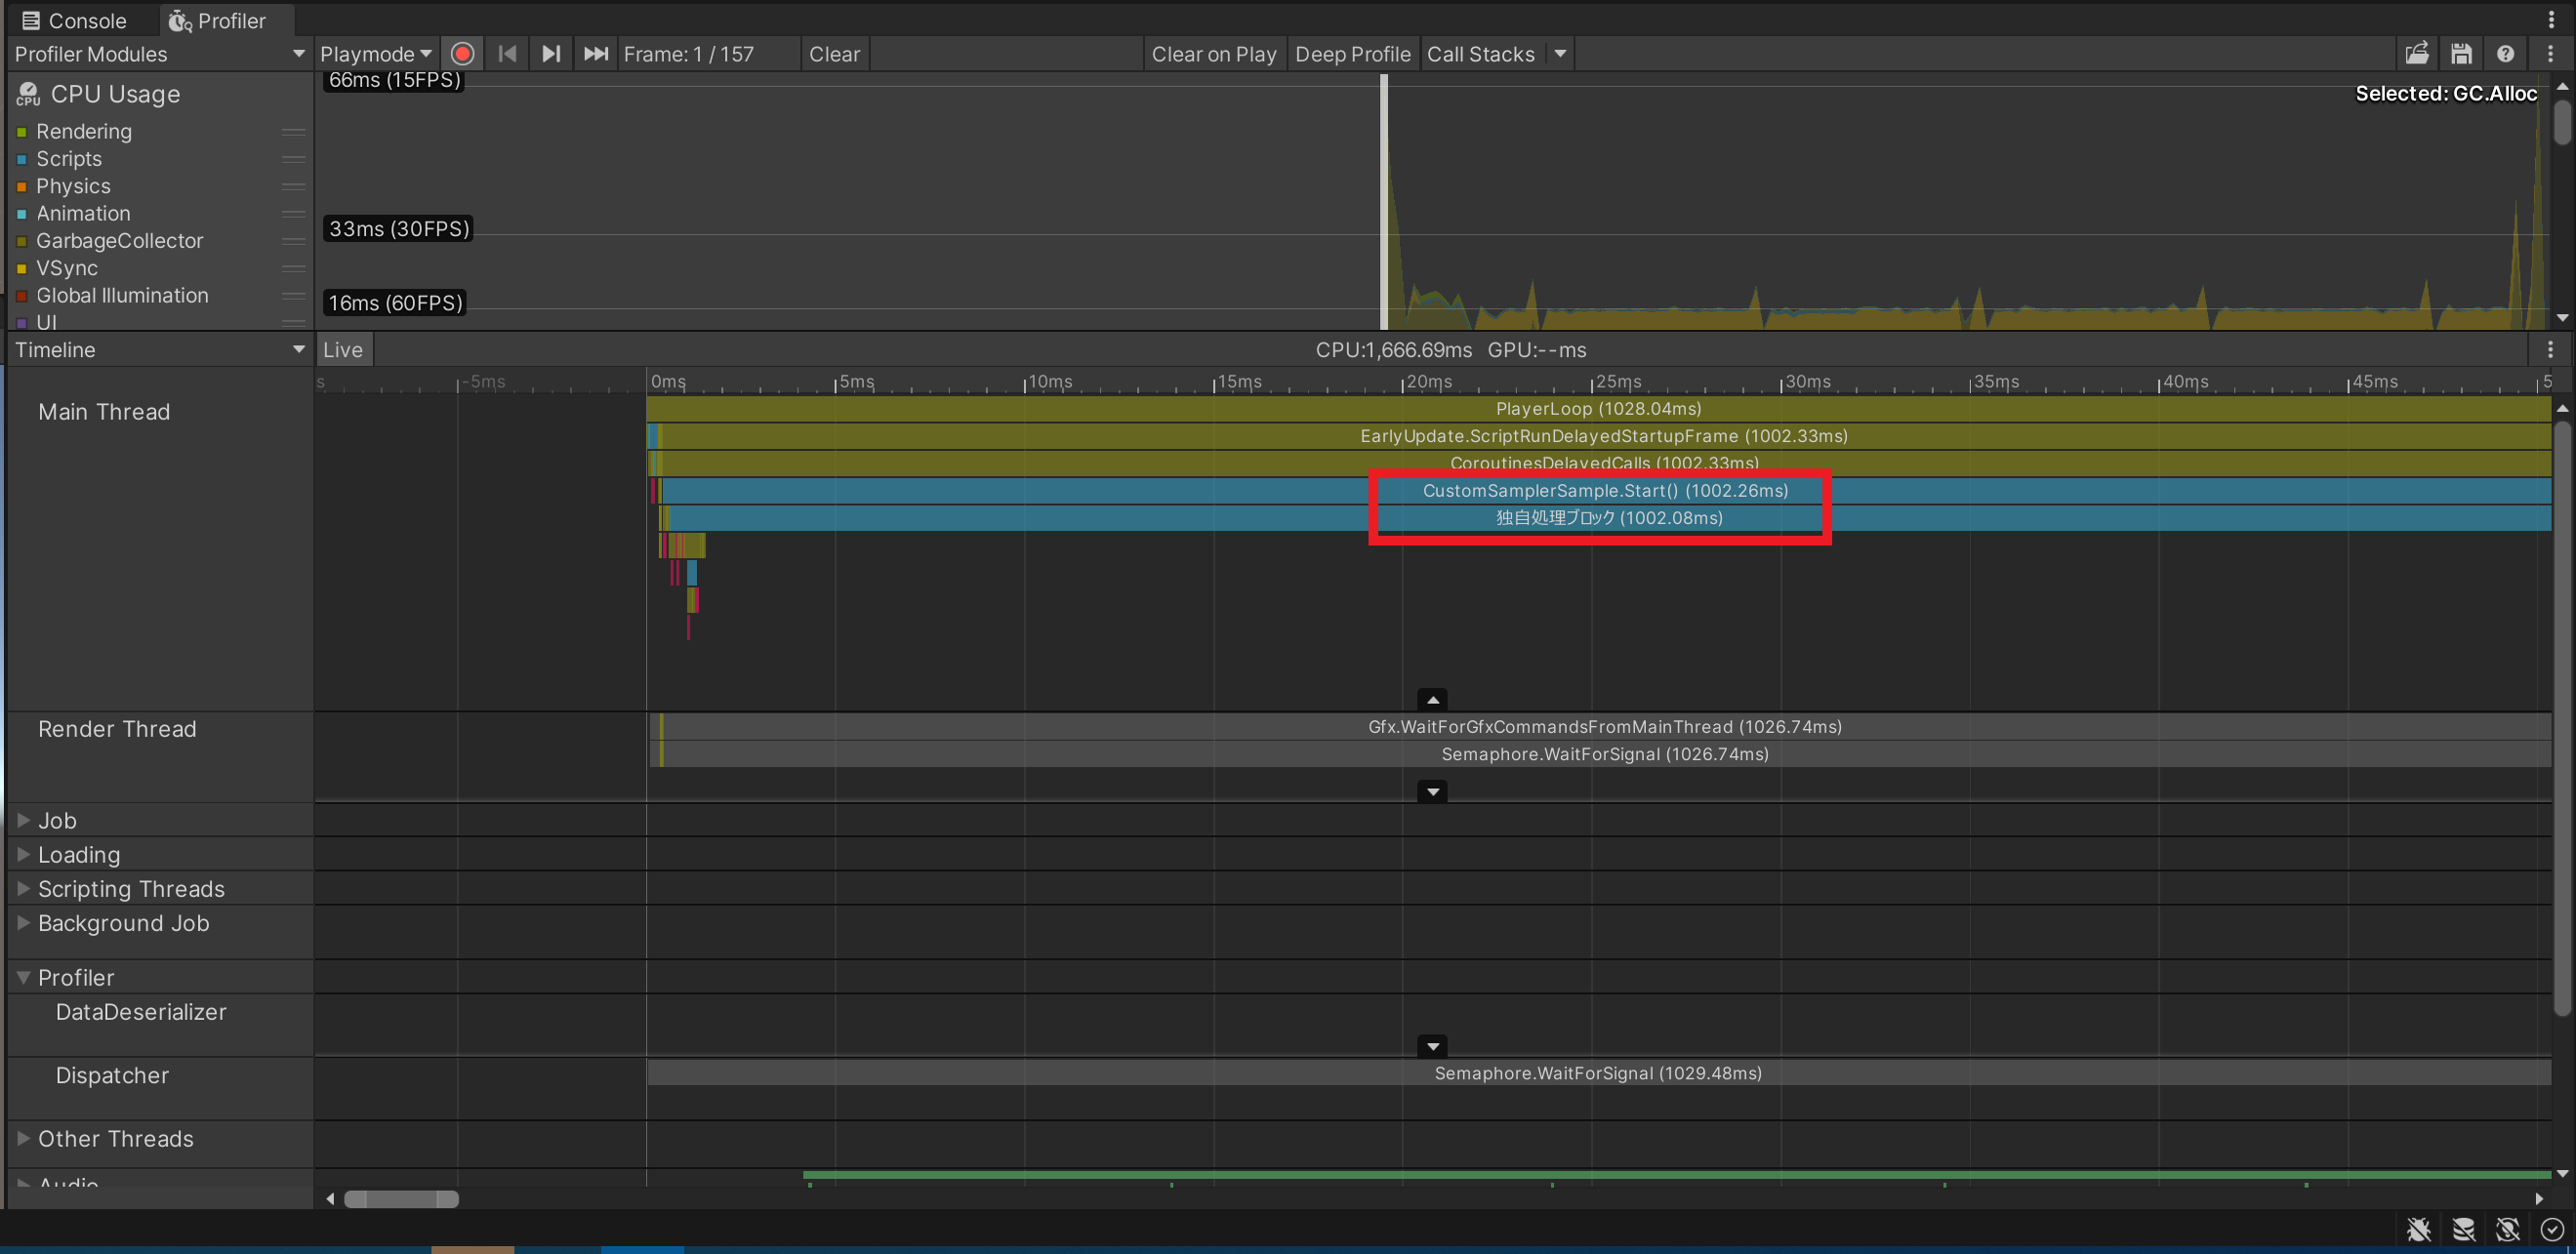
スクリプト処理を Profiler で計測
- CustomSampler を使用することで Profiler に載せることが可能
サンプル
using System.Threading;
using UnityEngine;
using UnityEngine.Profiling;

public class CustomSamplerSample : MonoBehaviour
{
    // 処理時間計測のために CustomSampler オブジェクトを作成
    CustomSampler customSampler = CustomSampler.Create("独自処理ブロック");
    void Start()
    {
        // Begin() - End() で囲った処理時間を Profiler に載せる
        customSampler.Begin();

        Debug.Log("独自処理開始");
        Thread.Sleep(1000);
        Debug.Log("独自処理終了");

        customSampler.End();
    }
}
Profiler の画面で「独自処理ブロック」を確認できる
ビルドしたアプリと Unity Profiler を接続
- iOSやAndroid実機で動作しているアプリを Profiler で確認可能
- 同じネットワーク上であれば Wi-Fi 経由でも利用可能
- 端末のIPアドレス指定でもOK
- Playmode のプルダウンから選択可能

Profiling.Recorder による CPU の Sample 情報取得
- Recorder を通して取得する
- MainThread の情報を取得したい場合は
FilterToCurrentThread() - 全 Thread の情報を取得したい場合は
CollectFromAllThreads()
- MainThread の情報を取得したい場合は
サンプル
using UnityEngine;
using UnityEngine.Profiling;

public class ProfilingRecorderCpuSample : MonoBehaviour
{
    bool onlyMainThread = false;
    Recorder recorder;

    void Start()
    {
        // Director.ProcessFrame という処理にどれくらいかかっているか取得
        this.recorder = Recorder.Get("Director.ProcessFrame");

        // MainThread のみの情報か、全ての Thread の情報を取得するか
        if (this.onlyMainThread)
        {
            this.recorder.FilterToCurrentThread();
        }
        else
        {
            this.recorder.CollectFromAllThreads();
        }
    }

    void Update()
    {
        Debug.Log("Total:" + (recorder.elapsedNanoseconds / 1000000.0f) + " ms(" + recorder.sampleBlockCount + "Instances) Z");
    }
}
Recorder による GPU 処理の測定
-
CustomSampler.Create(名前, true)で囲った箇所が対象となる - 全てのプラットフォームで利用できるわけではない
- 対応しているかどうかは
SystemInfo.supportsGpuRecorderで取得することが可能
- 対応しているかどうかは
カメラのレンダリングに掛かったGPU時間を取得するサンプル
using System.Collections;
using System.Collections.Generic;
using UnityEngine;
using UnityEngine.Profiling;

public class GPUProfilingSample : MonoBehaviour
{
    CustomSampler customSampler;
    Recorder recorder;

    void Start()
    {
        customSampler = CustomSampler.Create("MainCamera.Render", true);
        recorder = customSampler.GetRecorder();
    }

    void Update()
    {
        if (!SystemInfo.supportsGpuRecorder)
        {
            Debug.LogError("GPU計測をサポートしません.");
        }

        customSampler.Begin();
        Camera.main.Render();
        customSampler.End();

        Debug.Log("GPU " + recorder.gpuElapsedNanoseconds + " ns" + recorder.gpuSampleBlockCount + "回");
    }
}
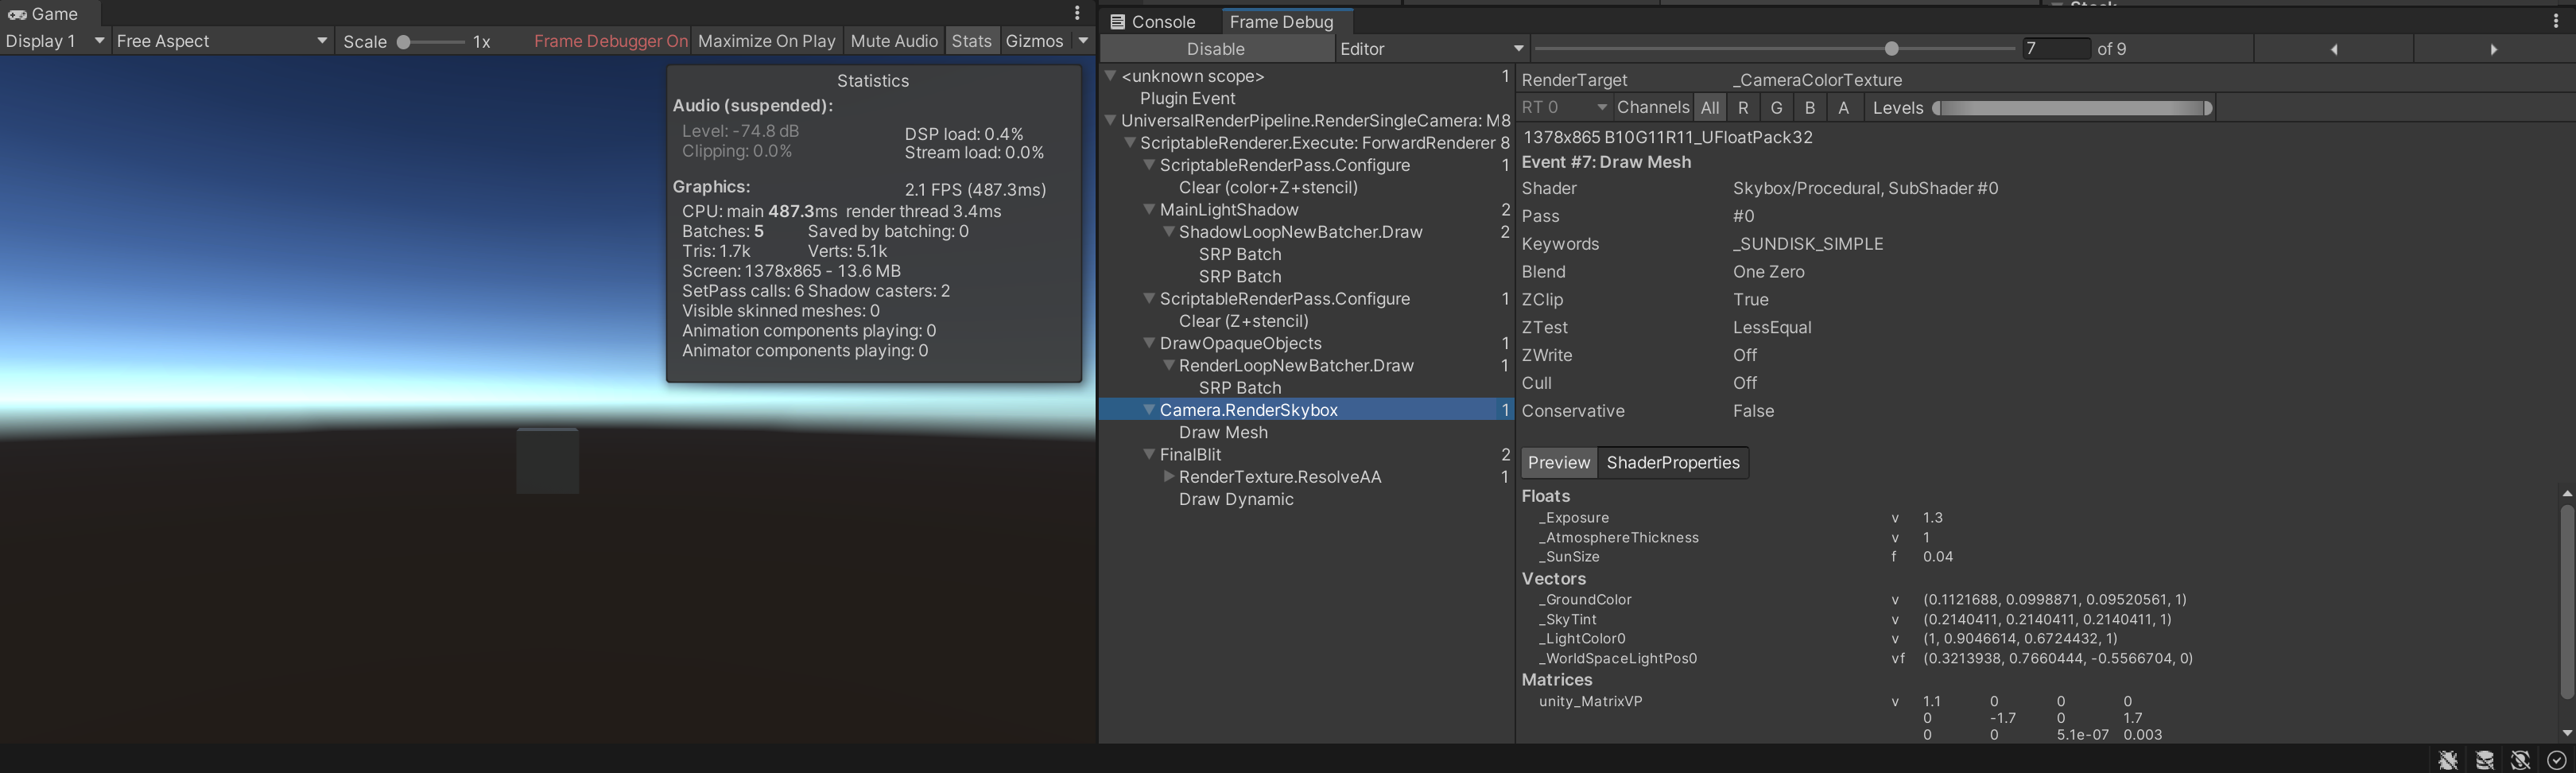
レンダリング統計ウィンドウ
- Game ウィンドウの Stats を選択すると表示できる

| 項目名 | 説明 |
|---|---|
| Time per frame and FPS | ゲームの 1 フレームを処理しレンダリングするのに要する時間 |
| Batches | バッチングが行われた回数 ※ 対象オブジェクトの頂点情報や描画設定を入れたデータ群(バッチ)を作成する処理 |
| Saved by batching | まとめたバッチの数 |
| Tris and Verts | 描画する三角形数と頂点数 |
| Screen | 画面サイズ、アンチエイリアスのレベル及びメモリ使用量 |
| SetPass | レンダーパスの数 |
| Visible Skinned Meshes | レンダリングされたスキンメッシュの数 |
| Animations | 再生アニメーションの数 |
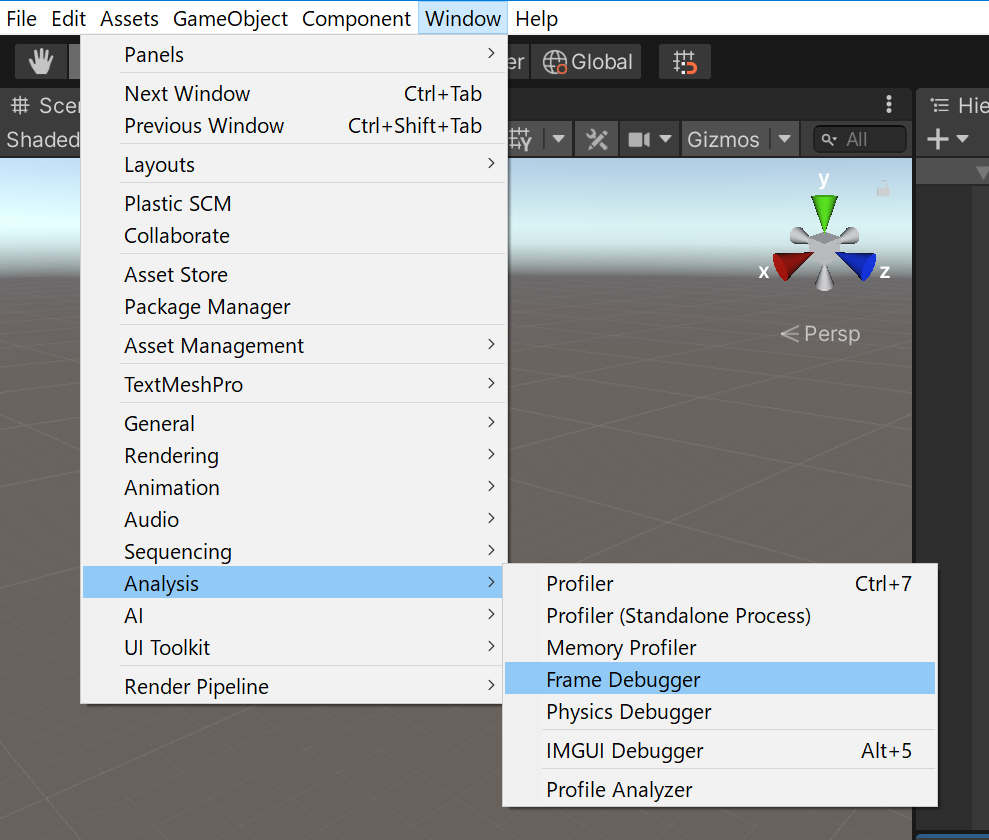
Frame Debugger
- Window > Analysis > Frame Debugger を選択すると開くことができる
- 特定のフレームをレンダリングするために使用される個々のドローコールを表示できる
- ドローコール:描画しなければいけないオブジェクト1つ1つに対して「このオブジェクトを描画して」という命令
※ Frame Debugger で描画順を確認している操作例

- ドローコール:描画しなければいけないオブジェクト1つ1つに対して「このオブジェクトを描画して」という命令
Cube オブジェクトを置いただけの場合
- SetPass Call は 5、Batches は 5
skybox を単色に変更すると…
- カメラオブジェクトの Inspector ビュー > Enviroment > Background Color を Solid Color に変更する
- Camera.RenderSkybox がいなくなる
- SetPass Call は 5、Batches は 4

影を無効化すると…
- ライトオブジェクトの Inspector ビュー > Shadow Type を No Shadow に変更する
- MainLightShadow がいなくなる
- SetPass Call は 2、Batches は 2

参考文献