概要
みなさんElasticsearchのプラグインは利用していますか?
現在Elastic社より「Marvel」「Shield」「Watcher」といったプラグインが提供されていますが、
本格的な運用時には必須といっていいほど有用なものばかりです。
今回はElasticsearchの有償プラグインである「Shield」を利用してElasticsearchの監査証跡を出力し、「Watcher」を利用して監査証跡から不正アクセスを検知しアラート(メール送信)を上げてみます。
はじめに
Shieldとは
公式:https://www.elastic.co/products/shield
Elasticsearchのセキュリティプラグインとなります。
Shieldを利用することでElasticsearchへのアクセスに対し認証・認可を実現したり、
IPフィルタリングや今回取り上げる監査証跡出力を設定したりすることができます。
Watcherとは
公式:https://www.elastic.co/products/watcher
Elasticsearchの検知アラートプラグインとなります。
Watcherを利用することでインデックスに登録されたデータから特定のキーワードを検知し、メール送信などのアクションを実行することができます。
本記事を読む前に
Shieldの認証・認可などにつきまして詳しく知りたい方は、以前投稿したこちらの記事をご参照頂けますと幸いです。
http://qiita.com/datake/items/a89f01ffa3429f9be4c4
Elasticsearchのプラグイン「Shield」を利用してELKをセキュアに!!
Kibanaにおける認証・認可を実現してみた
環境情報
- OS:CentOS6.5 on VirtualBox + Vagrant
- Logstash 2.1.1
- Elasticsearch 2.1.0
- Kibana 4.3.0
- Java 1.8.65
監査証跡出力
Shieldインストール1
/usr/share/elasticsearch/bin/plugin install elasticsearch/shield/latest
出力要否設定
監査証跡ログの出力はデフォルトだと無効になっているため、elasticsearch.ymlに以下を追記します。
shield.audit.enabled: true
出力先設定
監査証跡ログは「ファイル出力」と「Elasticsearchのインデックスへの取込み」が選択できます。
shield.audit.outputsで指定します。今回は両方を指定しています。
shield.audit.outputs: [index, logfile]
出力確認
上記設定が完了したらElasticsearchを再起動し、監査証跡ログの出力を確認します。
デフォルトだと/var/log/elasticsearch/elasticsearch-access.logにファイル出力されます。
[2015-12-19 04:04:36,480] [Taskmaster] [transport] [access_granted]     origin_type=[local_node], origin_address=[127.0.0.1], principal=[__indexing_audit_user], action=[indices:data/write/bulk]
[2015-12-19 04:04:36,480] [Taskmaster] [transport] [access_granted]     origin_type=[local_node], origin_address=[127.0.0.1], principal=[__indexing_audit_user], action=[indices:data/write/bulk[s]], indices=[.shield_audit_log-2015.12.19]
[2015-12-19 04:04:36,515] [Taskmaster] [transport] [access_granted]     origin_type=[rest], origin_address=[127.0.0.1], principal=[kibana4_server], action=[cluster:monitor/nodes/info]
[2015-12-19 04:04:36,515] [Taskmaster] [transport] [access_granted]     origin_type=[rest], origin_address=[127.0.0.1], principal=[kibana4_server], action=[cluster:monitor/nodes/info[n]]
[2015-12-19 04:04:36,526] [Taskmaster] [transport] [access_granted]     origin_type=[rest], origin_address=[127.0.0.1], principal=[kibana4_server], action=[cluster:monitor/health], indices=[.kibana]
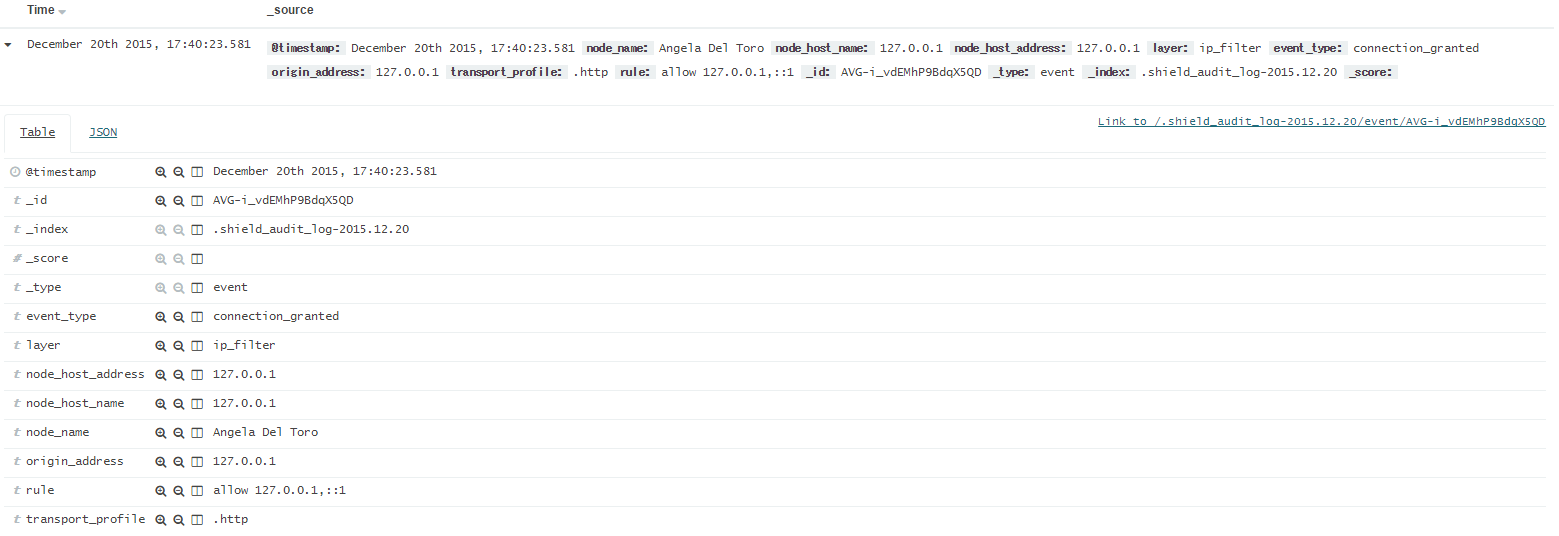
Elasticsearchへの取込みをKibanaから確認するとこんな感じです。
ログのエントリ種別
監査証跡ログが出力されるのは下記に示す種別のイベントが発生したときとなります。
| 種別 | 説明 |
|---|---|
| anonymous_access_denied | 認証トークンが付加されていないことによりリクエストが拒否された場合 |
| authentication_failed | 認証トークンがマッチしないことによりリクエストが拒否された場合 |
| authentication_failed[<realm>] | 認証トークンがマッチしないことによりリクエストが拒否された場合 (レルムごとに出力) |
| access_granted | ロールとして許可されている操作を行った場合(正常系) |
| access_denied | ロールとして許可されていない操作を行ったことによりリクエストが拒否された場合 |
| tampered_request | リクエストが改ざんされた場合 (typically relates tosearch/scroll requests when the scroll id is believed to be tampered) |
| connection_granted | IPフィルタリングによりTCPコネクションが許可された場合(正常系) |
| connection_denied | IPフィルタリングによりTCPコネクションが破棄された場合 |
ログのフォーマットについて
簡単にログのフォーマットを説明しておきます。
[<timestamp>] [<local_node_info>] [<layer>] [<entry_type>] <attribute_list>
- <timestamp>…タイムスタンプ
- <local_node_info>…ログエントリが出力されたノード情報
- <layer>…ログエントリが関連しているレイヤ(rest, transport, ip_filterのいずれか)
- <entry_type>…エントリ種別(上記参照)
- <attribute_list>…発生したイベントに付随する属性情報
不正アクセス検知・アラート
次にWatcherを利用して、不正アクセスの検知及びメール通知を行います。
今回は「不正アクセス」を「監査証跡にログ種別anonymous_access_deniedのログが出力されたとき」と定義します。
anonymous_access_deniedは「認証トークンが付加されていないことによりリクエストが拒否された場合に出力されるログ」ですね。
Watcherインストール1
/usr/share/elasticsearch/bin/plugin install elasticsearch/watcher/latest
Elasticsearchを再起動し、Watcherが起動していることを確認します。
warcher_stateがstartedとなっていればOKです。
既にshieldをインストールしているため、ユーザ・パスワードを指定してGETしています。
curl -XGET -u admin 'http://localhost:9200/_watcher/stats?pretty'
Enter host password for user 'admin':
{
  "watcher_state" : "started",
  "watch_count" : 0,
  "execution_thread_pool" : {
    "queue_size" : 0,
    "max_size" : 0
  },
  "manually_stopped" : false
}
Watch定義
POSTリクエストを投げ、Watcherのインデックスを追加することでWatch定義を追加します。
curl -XPUT -u admin 'http://localhost:9200/_watcher/watch/log_error_watch' -d '{
  "trigger" : {
    "schedule" : {
      "interval" : "10s"
    }
  }
, "input" : {
    "search" : {
      "request" : {
        "indices" : [ ".shield_audit_log-*" ]
      , "body" : {
          "query" : {
            "bool" : {
              "must" : [
                { "match": { "event_type" : "anonymous_access_denied"}}
              ]
            , "filter" : [
                { "range": { "@timestamp" : { "gte": "{{ctx.trigger.scheduled_time}}||-10s" }}}
              ]
            }
          }
        }
      }
    }
  }
, "condition" : {
    "compare" : {
      "ctx.payload.hits.total" : {
        "gt" : 0
      }
    }
  }
, "actions" : {
    "email_admin" : {
      "email": {
        "to" : "<Your Mail Address>"
      , "subject" : "【ERROR】Elasticsearch不正アクセス({{ctx.payload.hits.total}}件)"
      , "body" : {
          "text" : "{{ctx.payload.hits.hits}}"
        }
      }
    }
  }
}'
上記は10秒間隔でElasticsearchの監査証跡ログが登録されたインデックスを検索し、
不正アクセスログを検知したらメールにて通知を投げるという定義になります。
以下、順を追って見ていきましょう。
Watch定義は大きくtrigger、input、condition、actionsの4つに分類できます。
trigger
triggerはWatherを起動するトリガーを定義します。
ここではスケジュールトリガー利用して10秒間隔でWatcherを起動しています。
  "trigger" : {
    "schedule" : {
      "interval" : "10s"
    }
  }
参考:https://www.elastic.co/guide/en/watcher/current/trigger.html
input
inputはWatcherの監査対象を定義します。
ここでは.shield_audit_logインデックスに登録されたドキュメントの中から
event_typeフィールドがanonymous_access_deniedとなるものを抽出しています。
またログのタイムスタンプが「Watcher起動がスケジューリングされた時間 - 10秒」より大きいものをフィルタリングすることで、一度検知したログを二重に検知しないようにしています。
  "input" : {
    "search" : {
      "request" : {
        "indices" : [ ".shield_audit_log-*" ]
      , "body" : {
          "query" : {
            "bool" : {
              "must" : [
                { "match": { "event_type" : "anonymous_access_denied"}}
              ]
            , "filter" : [
                { "range": { "@timestamp" : { "gte": "{{ctx.trigger.scheduled_time}}||-10s" }}}
              ]
            }
          }
        }
      }
    }
  }
参考:https://www.elastic.co/guide/en/watcher/current/input.html
condition
Watcherのアクションを実行するかどうかの条件を定義します。
ここではinputの件数が0件以上の場合にアクションを実行するよう定義しています。
  "condition" : {
    "compare" : {
      "ctx.payload.hits.total" : {
        "gt" : 0
      }
    }
  }
参考:https://www.elastic.co/guide/en/watcher/current/condition.html
actions
watch対象を検知した場合のアクションを定義します。
メール送信、Slack連携、Hipchat連携、ログ出力など様々なアクションがありますが、
ここではメール送信を行います。
  "actions" : {
    "email_admin" : {
      "email": {
        "to" : "<Your Mail Address>"
      , "subject" : "【ERROR】Elasticsearch不正アクセス({{ctx.payload.hits.total}}件)"
      , "body" : {
          "text" : "{{ctx.payload.hits.hits}}"
        }
      }
    }
  }
参考:https://www.elastic.co/guide/en/watcher/current/actions.html
メール送信を行う場合はelasticsearch.ymlにメールアカウントを設定しておく必要があります。
今回はGMailのSMTPサーバを利用します。23
watcher.actions.email.service.account:
    gmail_account:
        profile: gmail
        smtp:
            auth: true
            starttls.enable: true
            host: smtp.gmail.com
            port: 587
            user: <Google Account>
            password: <Google Password>
参考:https://www.elastic.co/guide/en/watcher/current/email-services.html#gmail
確認
ここまで完了したらElasticsearchを再起動して、監査証跡ログの検知及びメール送信を確認します。
不正アクセス
認証トークンなしでElasticsearchのAPIをキックします。認証エラーとなりますね。
curl -XGET 'http://localhost:9200'
{"error":{"root_cause":[{"type":"security_exception","reason":"missing authentication token for REST request [/]","header":{"WWW-Authenticate":"Basic realm=\"shield\""}}],"type":"security_exception","reason":"missing authentication token for REST request [/]","header":{"WWW-Authenticate":"Basic realm=\"shield\""}},"status":401}
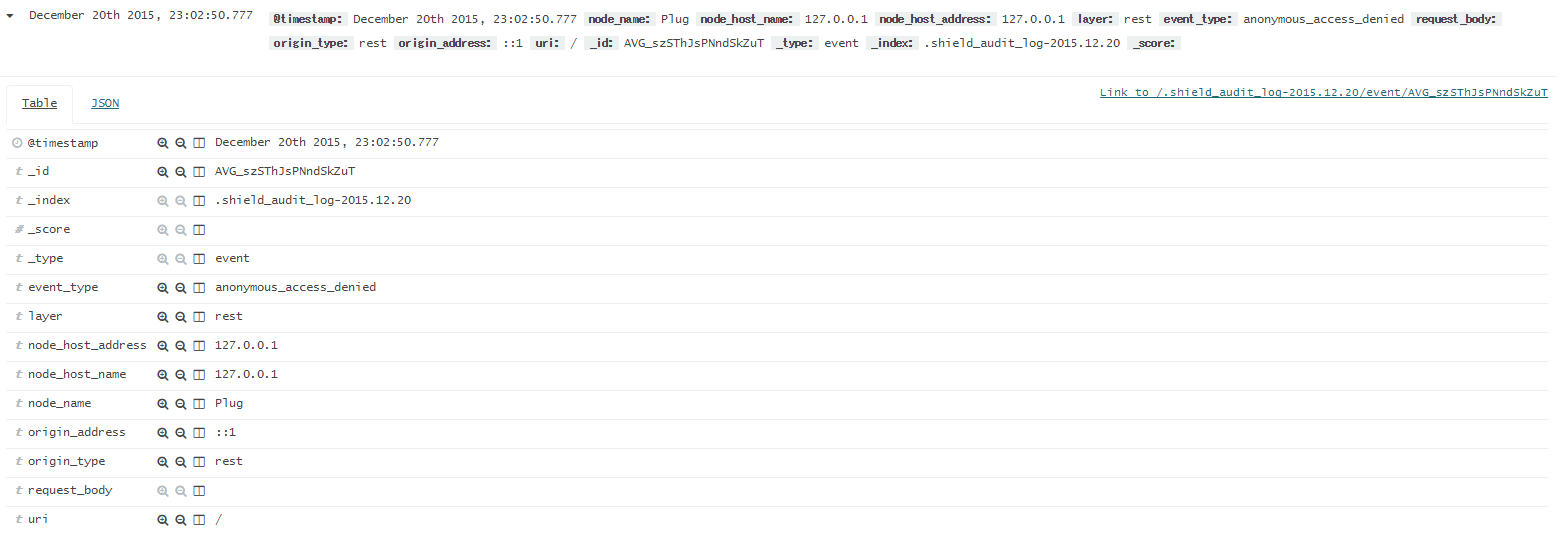
監査証跡ログ、Elasticsearchの.shield_audit_logインデックスにも確かに出力されています。
[2015-12-20 22:56:50,628] [Plug] [rest] [anonymous_access_denied] origin_address=[::1], uri=[/]
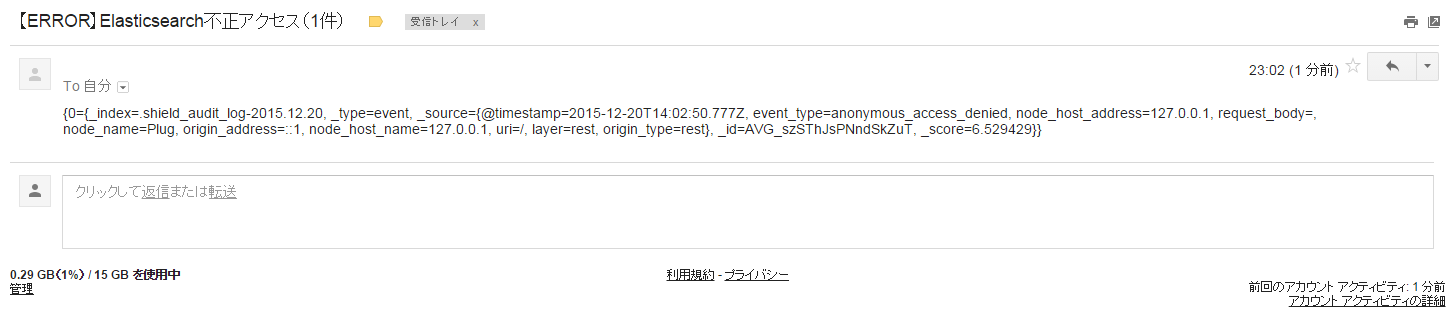
メール通知
Gmailを見ると確かにアラートメールが飛んできています。ばっちりですね。
Watch定義削除
不要になったWatch定義は下記の通り削除します。
curl -XDELETE -u admin 'http://localhost:9200/_watcher/watch/log_error_watch'
まとめ
いかがでしたでしょうか。
前回の記事に引き続き、Elasticsearchのプラグインを利用してセキュリティ周りを整備してみました。
Watcherの定義はKibana上からGUIでできるといいなーと思ったり。
機会があればSlack連携、Hipchat連携等も試してみたいですね。
ElasticsearchのAdvent Calender1日遅刻してしまい、すみませんでしたm(_ _)m
どなたか知見があれば
Shieldの監査証跡ログ出力を「有効」にし、出力先に「Elasticsearchのインデックスへの取込み」を指定した状態でKibanaを起動すると、監査証跡ログのインデックス取込みが無限ループします。
挙動としては、Kibanaがインデックスを読込む操作が監査ログとしてインデックスに取込まれ、Kibanaがそのインデックスをさらに読込み…が繰り返されている模様。
監査証跡ログの出力レベルをERROR等にしてあげれば問題ない気もしますが、どなたか知見ございましたらご教示ください。
[2015-12-20 23:16:39,379] [Plug] [transport] [access_granted]   origin_type=[local_node], origin_address=[127.0.0.1], principal=[__indexing_audit_user], action=[indices:data/write/bulk[s]], indices=[.shield_audit_log-2015.12.20,.shield_audit_log-2015.12.20,.shield_audit_log-2015.12.20]
[2015-12-20 23:16:49,222] [Plug] [transport] [access_granted]   origin_type=[local_node], origin_address=[127.0.0.1], principal=[__watcher_user], action=[indices:data/write/index], indices=[.triggered_watches]
[2015-12-20 23:16:49,277] [Plug] [transport] [access_granted]   origin_type=[local_node], origin_address=[127.0.0.1], principal=[__watcher_user], action=[indices:data/read/search], indices=[.shield_audit_log-2015.12.19,.shield_audit_log-2015.12.20]
[2015-12-20 23:16:49,277] [Plug] [transport] [access_granted]   origin_type=[local_node], origin_address=[127.0.0.1], principal=[__watcher_user], action=[indices:data/read/search], indices=[.shield_audit_log-2015.12.19,.shield_audit_log-2015.12.20]
[2015-12-20 23:16:49,279] [Plug] [transport] [access_granted]   origin_type=[local_node], origin_address=[127.0.0.1], principal=[__watcher_user], action=[indices:data/read/search[phase/query]], indices=[.shield_audit_log-2015.12.19,.shield_audit_log-2015.12.20]
[2015-12-20 23:16:49,281] [Plug] [transport] [access_granted]   origin_type=[local_node], origin_address=[127.0.0.1], principal=[__watcher_user], action=[indices:data/read/search[phase/query]], indices=[.shield_audit_log-2015.12.19,.shield_audit_log-2015.12.20]
[2015-12-20 23:16:49,285] [Plug] [transport] [access_granted]   origin_type=[local_node], origin_address=[127.0.0.1], principal=[__watcher_user], action=[indices:data/read/search[phase/query]], indices=[.shield_audit_log-2015.12.19,.shield_audit_log-2015.12.20]
[2015-12-20 23:16:49,287] [Plug] [transport] [access_granted]   origin_type=[local_node], origin_address=[127.0.0.1], principal=[__watcher_user], action=[indices:data/read/search[phase/query]], indices=[.shield_audit_log-2015.12.19,.shield_audit_log-2015.12.20]
[2015-12-20 23:16:49,293] [Plug] [transport] [access_granted]   origin_type=[local_node], origin_address=[127.0.0.1], principal=[__watcher_user], action=[indices:data/read/search[phase/query]], indices=[.shield_audit_log-2015.12.19,.shield_audit_log-2015.12.20]
[2015-12-20 23:16:49,295] [Plug] [transport] [access_granted]   origin_type=[local_node], origin_address=[127.0.0.1], principal=[__watcher_user], action=[indices:data/read/search[phase/query]], indices=[.shield_audit_log-2015.12.19,.shield_audit_log-2015.12.20]
[2015-12-20 23:16:49,297] [Plug] [transport] [access_granted]   origin_type=[local_node], origin_address=[127.0.0.1], principal=[__watcher_user], action=[indices:data/read/search[phase/query]], indices=[.shield_audit_log-2015.12.19,.shield_audit_log-2015.12.20]
[2015-12-20 23:16:49,298] [Plug] [transport] [access_granted]   origin_type=[local_node], origin_address=[127.0.0.1], principal=[__watcher_user], action=[indices:data/read/search[phase/query]], indices=[.shield_audit_log-2015.12.19,.shield_audit_log-2015.12.20]
[2015-12-20 23:16:49,300] [Plug] [transport] [access_granted]   origin_type=[local_node], origin_address=[127.0.0.1], principal=[__watcher_user], action=[indices:data/read/search[phase/query]], indices=[.shield_audit_log-2015.12.19,.shield_audit_log-2015.12.20]
[2015-12-20 23:16:49,302] [Plug] [transport] [access_granted]   origin_type=[local_node], origin_address=[127.0.0.1], principal=[__watcher_user], action=[indices:data/read/search[phase/query]], indices=[.shield_audit_log-2015.12.19,.shield_audit_log-2015.12.20]
[2015-12-20 23:16:49,305] [Plug] [transport] [access_granted]   origin_type=[local_node], origin_address=[127.0.0.1], principal=[__watcher_user], action=[indices:data/write/index], indices=[.watch_history-2015.12.20]
[2015-12-20 23:16:49,344] [Plug] [transport] [access_granted]   origin_type=[local_node], origin_address=[127.0.0.1], principal=[__watcher_user], action=[indices:data/write/delete], indices=[.triggered_watches]
[2015-12-20 23:16:49,395] [Plug] [transport] [access_granted]   origin_type=[local_node], origin_address=[127.0.0.1], principal=[__indexing_audit_user], action=[indices:data/write/bulk]
[2015-12-20 23:16:49,397] [Plug] [transport] [access_granted]   origin_type=[local_node], origin_address=[127.0.0.1], principal=[__indexing_audit_user], action=[indices:data/write/bulk[s]], indices=[.shield_audit_log-2015.12.20,.shield_audit_log-2015.12.20,.shield_audit_log-2015.12.20]
[2015-12-20 23:16:49,397] [Plug] [transport] [access_granted]   origin_type=[local_node], origin_address=[127.0.0.1], principal=[__indexing_audit_user], action=[indices:data/write/bulk[s]], indices=[.shield_audit_log-2015.12.20,.shield_audit_log-2015.12.20,.shield_audit_log-2015.12.20]
[2015-12-20 23:16:49,398] [Plug] [transport] [access_granted]   origin_type=[local_node], origin_address=[127.0.0.1], principal=[__indexing_audit_user], action=[indices:data/write/bulk[s]], indices=[.shield_audit_log-2015.12.20,.shield_audit_log-2015.12.20,.shield_audit_log-2015.12.20,.shield_audit_log-2015.12.20,.shield_audit_log-2015.12.20]
参考(公式サイト以外)
- http://dev.classmethod.jp/cloud/aws/using-elasticsearch-plugin-shield/
- http://dev.classmethod.jp/cloud/aws/using-elasticsearch-plugin-watcher/