みなさん、自動売買botの損益ってどうやって確認してますか?
bitflyerだとアプリで損益グラフが見れますが、これは口座全体の損益になってしまうので、手動スキャをしてたり、複数botを運用していたりすると合算して表示されてしまいます。
私はこれまで、botごとに以下のようなcsvファイルを出力させ、これをチャットワークに飛ばしたりExcelに貼り付けてグラフ化したりして確認してました。
TIME,SONNEKI
2018-02-09 00:35:56,51
2018-02-09 00:45:53,14
2018-02-09 00:56:21,181
2018-02-09 01:06:01,129
2018-02-09 01:14:56,239
2018-02-09 01:26:14,351
2018-02-09 01:36:25,401
2018-02-09 01:46:16,403
2018-02-09 01:56:29,361
ただ、いちいちExcelに貼り付けるのはめんどうなので、今回は自動的に(かつ良い感じに)グラフ化してくれるDashByPlotlyというツールを使って損益を可視化してみたいと思います。
とりあえず公式ページのチュートリアルをやってみます。
https://plot.ly/products/dash/
まずはお馴染みのpip installですね。
pip install dash==0.21.0  # The core dash backend
pip install dash-renderer==0.11.3  # The dash front-end
pip install dash-html-components==0.9.0  # HTML components
pip install dash-core-components==0.18.1  # Supercharged components
pip install plotly --upgrade  # Plotly graphing library used in examples
簡単に終わると思いきや、やってみると以下のエラー発生。!
coincheck 0.1.10 has requirement pytz==2016.7, but you'll have pytz 2018.3 which is incompatible.
coincheck 0.1.10 has requirement requests==2.6.0, but you'll have requests 2.18.4 which is incompatible.
bitflyer 0.0.1 has requirement pytz==2015.7, but you'll have pytz 2018.3 which is incompatible.
bitflyer 0.0.1 has requirement requests==2.6.0, but you'll have requests 2.18.4 which is incompatible.
pip installでのエラーは心臓に悪いですが、落ち着いてとりあえずエラーメッセージをよく見て、以下のコマンドを実行します
pip install pytz -U
pip install requests -U
また、coincheckライブラリとbitflyerライブラリは、今となってはccxtがあるので不要なのでアンインストールしました。
pip uninstall coincheck
pip uninstall bitflyer
これで改めてDashByPlotlyのインストールを実行
pip install dash==0.21.0  # The core dash backend
pip install dash-renderer==0.11.3  # The dash front-end
pip install dash-html-components==0.9.0  # HTML components
pip install dash-core-components==0.18.1  # Supercharged components
pip install plotly --upgrade  # Plotly graphing library used in examples
よし、無事に完了しました。
とりあえずHello Worldしてみます。
# -*- coding: utf-8 -*-
import dash
import dash_core_components as dcc
import dash_html_components as html

app = dash.Dash()

app.layout = html.Div(children=[
    html.H1(children='Hello Dash'),

    html.Div(children='''
        Dash: A web application framework for Python.
    '''),

    dcc.Graph(
        id='example-graph',
        figure={
            'data': [
                {'x': [1, 2, 3], 'y': [4, 1, 2], 'type': 'bar', 'name': 'SF'},
                {'x': [1, 2, 3], 'y': [2, 4, 5], 'type': 'bar', 'name': 'Montréal'},
            ],
            'layout': {
                'title': 'Dash Data Visualization'
            }
        }
    )
])

if __name__ == '__main__':
    app.run_server(debug=True)
ブラウザから以下にアクセスしてみます。
http://127.0.0.1:8050
良い感じですね!
今回は損益の推移を可視化したいので、棒グラフではなく折れ線グラフがいいです。
なので、typeをbar⇒Scatterに修正してみます。
おお、ちゃんと折れ線グラフになってる。
今度は、実際のデータを利用してみます。
利用するデータは先ほどのcsvファイルです。
TIME,SONNEKI
2018-02-09 00:35:56,51
2018-02-09 00:45:53,14
2018-02-09 00:56:21,181
2018-02-09 01:06:01,129
2018-02-09 01:14:56,239
2018-02-09 01:26:14,351
2018-02-09 01:36:25,401
2018-02-09 01:46:16,403
2018-02-09 01:56:29,361
※表示されているのはデータの一部分です。
これをpandasのdfとして読み込んで利用します。
まずはimport文を追加。
import pandas as pd
そしてcsvの読み込み
df = pd.read_csv('./suii_coincheck.csv')
dataの部分は以下のようにします。
'x': df['TIME'], 'y': df['SONNEKI'], 'type': 'Scatter', 'name': '損益'
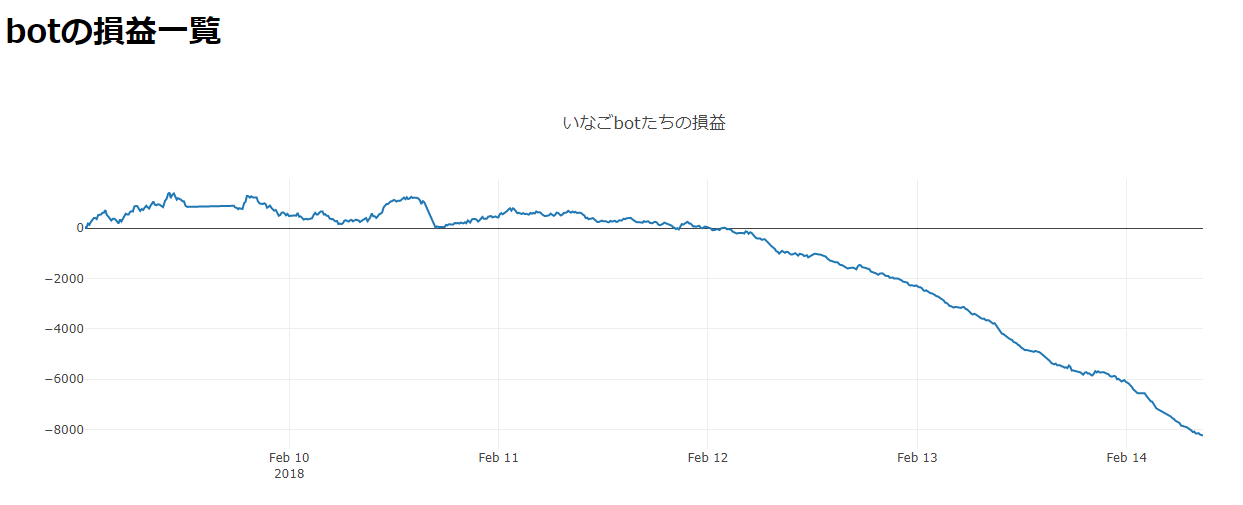
あとはhtmlのchildrenの部分を修正して、最終的なコードは以下になりました。
# -*- coding: utf-8 -*-
import dash
import dash_core_components as dcc
import dash_html_components as html
import pandas as pd

app = dash.Dash()

df = pd.read_csv('./suii_coincheck.csv')

app.layout = html.Div(children=[
    html.H1(children='botの損益一覧'),

    dcc.Graph(
        id='example-graph',
        figure={
            'data': [
                {'x': df['TIME'], 'y': df['SONNEKI'], 'type': 'Scatter', 'name': '損益'}
            ],
            'layout': {
                'title': 'いなごbotたちの損益'
            }
        }
    )
])

if __name__ == '__main__':
    app.run_server(debug=True)
あ、あれ。。なんかテンション下がってきたぞ。。
なにこのきれいな右肩下がり。。
ま、まあ気を取り直して、グラフが1つだけだと寂しいので取引所別のグラフを複数出してみます。
やり方は簡単でdataを増やすだけですね。
# -*- coding: utf-8 -*-
import dash
import dash_core_components as dcc
import dash_html_components as html
import pandas as pd

app = dash.Dash()

df_coincheck = pd.read_csv('./suii_coincheck.csv')
df_zaif = pd.read_csv('./suii_zaif.csv')
df_bitflyer = pd.read_csv('./suii_bitflyer.csv')
df_bitbank = pd.read_csv('./suii_bitbank.csv')

app.layout = html.Div(children=[
    html.H1(children='botの損益一覧'),

    dcc.Graph(
        id='example-graph',
        figure={
            'data': [
                {'x': df_coincheck['TIME'], 'y': df_coincheck['SONNEKI'],
                    'type': 'Scatter', 'name': 'coincheck'},
                {'x': df_zaif['TIME'],      'y': df_zaif['SONNEKI'],
                    'type': 'Scatter', 'name': 'zaif'},
                {'x': df_bitflyer['TIME'],  'y': df_bitflyer['SONNEKI'],
                    'type': 'Scatter', 'name': 'bitflyer'},
                {'x': df_bitbank['TIME'],   'y': df_bitbank['SONNEKI'],
                    'type': 'Scatter', 'name': 'bitbank'}
            ],
            'layout': {
                'title': 'いなごbotたちの損益'
            }
        }
    )
])

if __name__ == '__main__':
    app.run_server(debug=True)
そうすると以下のようになります。
う、うーん。。
coincheckが足を引っ張りすぎてトータルマイナスっぽいですね。。
せっかくなので取引所ごとの表示・非表示をチェックボックスで選択できるようにしてみました。
また、取引所をリストで保持するよう修正します。
# -*- coding: utf-8 -*-
import dash
import dash_core_components as dcc
import dash_html_components as html
import pandas as pd
from dash.dependencies import Input, Output
import plotly.graph_objs as go

app = dash.Dash()

exchanges = ['coincheck', 'zaif', 'bitflyer', 'bitbank']

app.layout = html.Div(children=[
    html.H1(children='botの損益一覧'),

    dcc.Checklist(
        id='inago-checklist',
        options=[{'label': i, 'value': i} for i in exchanges],
        values=['zaif', 'bitflyer']
    ),

    dcc.Graph(
        id='inago-graph'
    )
])

@app.callback(
    dash.dependencies.Output('inago-graph', 'figure'),
    [dash.dependencies.Input('inago-checklist', 'values')]
)
def update_figure(checkedexchanges):

    traces = []
    for i in checkedexchanges:
        csv_name = './suii_' + i + '.csv'
        df = pd.read_csv(csv_name)
        traces.append(go.Scatter(
            x=df['TIME'],
            y=df['SONNEKI'],
            name=i
        ))

    return {
        'data': traces,
        'layout': go.Layout(
            title='いなごbotたちの損益'
        )
    }


if __name__ == '__main__':
    app.run_server(debug=True)
update_figure関数はチェックボックスを選択すると自動的に呼ばれる関数です。
デフォルトチェックはzaifとbitflyerをチェック状態にしているので、初期画面では「お、良い感じやん!」ってなりますね。
ただ、coincheckとbitbankのチェックを押すと、、
はいドーン。
残念でしたー。
トータル損でしたー。
いや、ほんとに、時間かけてbot作って損するって悲しすぎますね。
テンション下がりますわ。。
まあ、とにかくDashByPlotlyが便利で面白いのは間違いないのでぜひ皆さんも使ってみてください。
ではでは。


