挨拶
レンウッドといいます。Hadley Wickham氏のR for Data Scienceを学習するにあたり、記録を残していこうと思います。
ここ誤解してるよ、とか、こうした方がいいよ、とかアドバイスあったらありがたいです。
R for Data Science: http://r4ds.had.co.nz/
基本構文
ggplot(data = <DATA>) +
  <GEOM_FUNCTION>(
     mapping = aes(<MAPPINGS>),
     stat = <STAT>,
     position = <POSITION>
  ) +
  <COORDINATE_FUNCTION> +
  <FACET_FUNCTION>
各要素の(自分なりの)説明
-
<DATA>
グラフの元となるデータ -
<GEOM_FUNCTION>
グラフの種類を決める。以下代表的なもの
geom_point: 散布図
geom_jitter: 散布図に、点が重ならないようノイズを加えたもの
geom_smooth: なめらかな線
geom_bar: 度数の棒グラフ
geom_col: 度数ではなく、別の変数の値を取れる棒グラフ
geom_boxplot: 箱ひげ図
など -
<MAPPINGs>
グラフの要素を指定する。変数や色など。 -
<STAT>
グラフに使われる計算。geomと対応しているものもある。 -
<POSITION>
グラフの棒や色などの配置方法。identity, fill, dodge, jitterなどがある。 -
<COORDINATE_FUNCTION>
グラフを横にしたり、極座標に変えたりする。 -
<FACET_FUNCTION>
カテゴリごとにグラフを分けることができる。
よくわからなかったところ
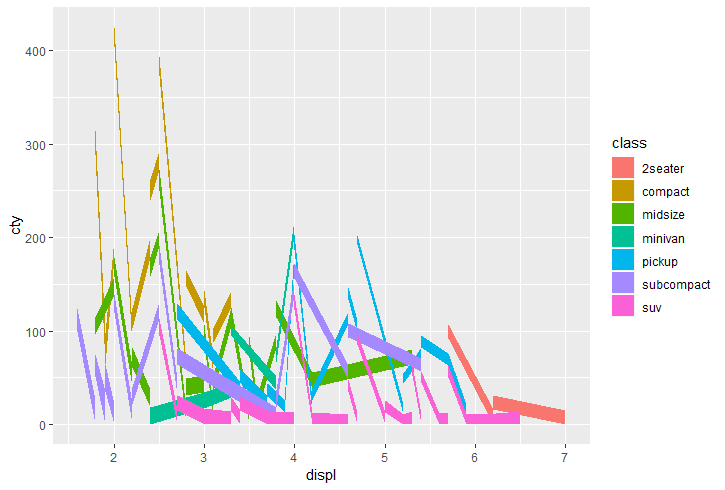
geom_area()が何をやるものなのかよくわからなかった。
ggplot(data = mpg) + geom_area(mapping = aes(x = displ, y = cty, group = class, fill = class))
何これ?
後で分かったら記事にするかも。
