1. はじめに
Raspberry Piのシステム情報を一括で視覚的に確認できたら便利だと思いTUIツールであるTextualを用いてモニターを作成しました。
この記事でわかること・対象読者
- PythonのTUIフレームワークTextualの基本的な使い方
- SSH経由でRaspberry Piの情報を取得し、PC上でモニタリングするプログラムの実装例
2. 使用技術・環境
| OS | Windows11 |
|---|---|
| 言語 | Python 3.12.0 |
| OS | Raspbian GNU/Linux 12 (bookworm) |
|---|---|
| 言語 | Python 3.11.2 |
2-1. Textual
Textualは、Python製のTUI(Text User Interface)アプリケーションを簡単に作成できるフレームワークです。GUIのようなリッチなUIをターミナル上で実現でき、ウィジェットやレイアウト、スタイル指定も柔軟です。
3. 実装
Raspberry PiとPCの公開鍵方式によるSSH接続が完了している前提として進めます。
また、本記事で紹介しているmain.pyはGitHub Gistで全文を公開しています。
3-1. ライブラリのインストール
まず、PC側でTextualをインストールします。
pip install textual
Raspberry Pi側では、システム情報取得のためにpsutilをインストールしておきます。
pip install psutil
3-2. システム情報取得スクリプト
Raspberry Pi上に~/Project/sys_info.pyというファイル名で、以下のスクリプトを配置します。CPU使用率、メモリ使用率、ディスク使用率、温度、ネットワーク送受信量をJSON形式で出力します。
import psutil
import json
import subprocess

def get_temp():
    out = subprocess.check_output(["vcgencmd", "measure_temp"]).decode()
    return float(out.replace("temp=", "").replace("'C\n", ""))

def get_network_data():
    net_io = psutil.net_io_counters()
    return {
        "bytes_sent": net_io.bytes_sent,
        "bytes_recv": net_io.bytes_recv,
    }

net_data = get_network_data()

info = {
    "cpu": psutil.cpu_percent(interval=1),
    "mem": psutil.virtual_memory().percent,
    "disk": psutil.disk_usage("/").percent,
    "temp": get_temp(),
    "net_bytes_sent": net_data["bytes_sent"],
    "net_bytes_recv": net_data["bytes_recv"],
}

print(json.dumps(info))
3-3. ファイル転送
作成したスクリプトをPCからRaspberry Piへ転送するには、scpコマンドが便利です。
-
-iで秘密鍵を指定 - ユーザー名とホスト名は環境に合わせて変更します
scp -i your_key sys_info.py raspi_user_name@raspi_host_name.local:~/Project/sys_info.py
3-4. Textualアプリのウィジェット構成
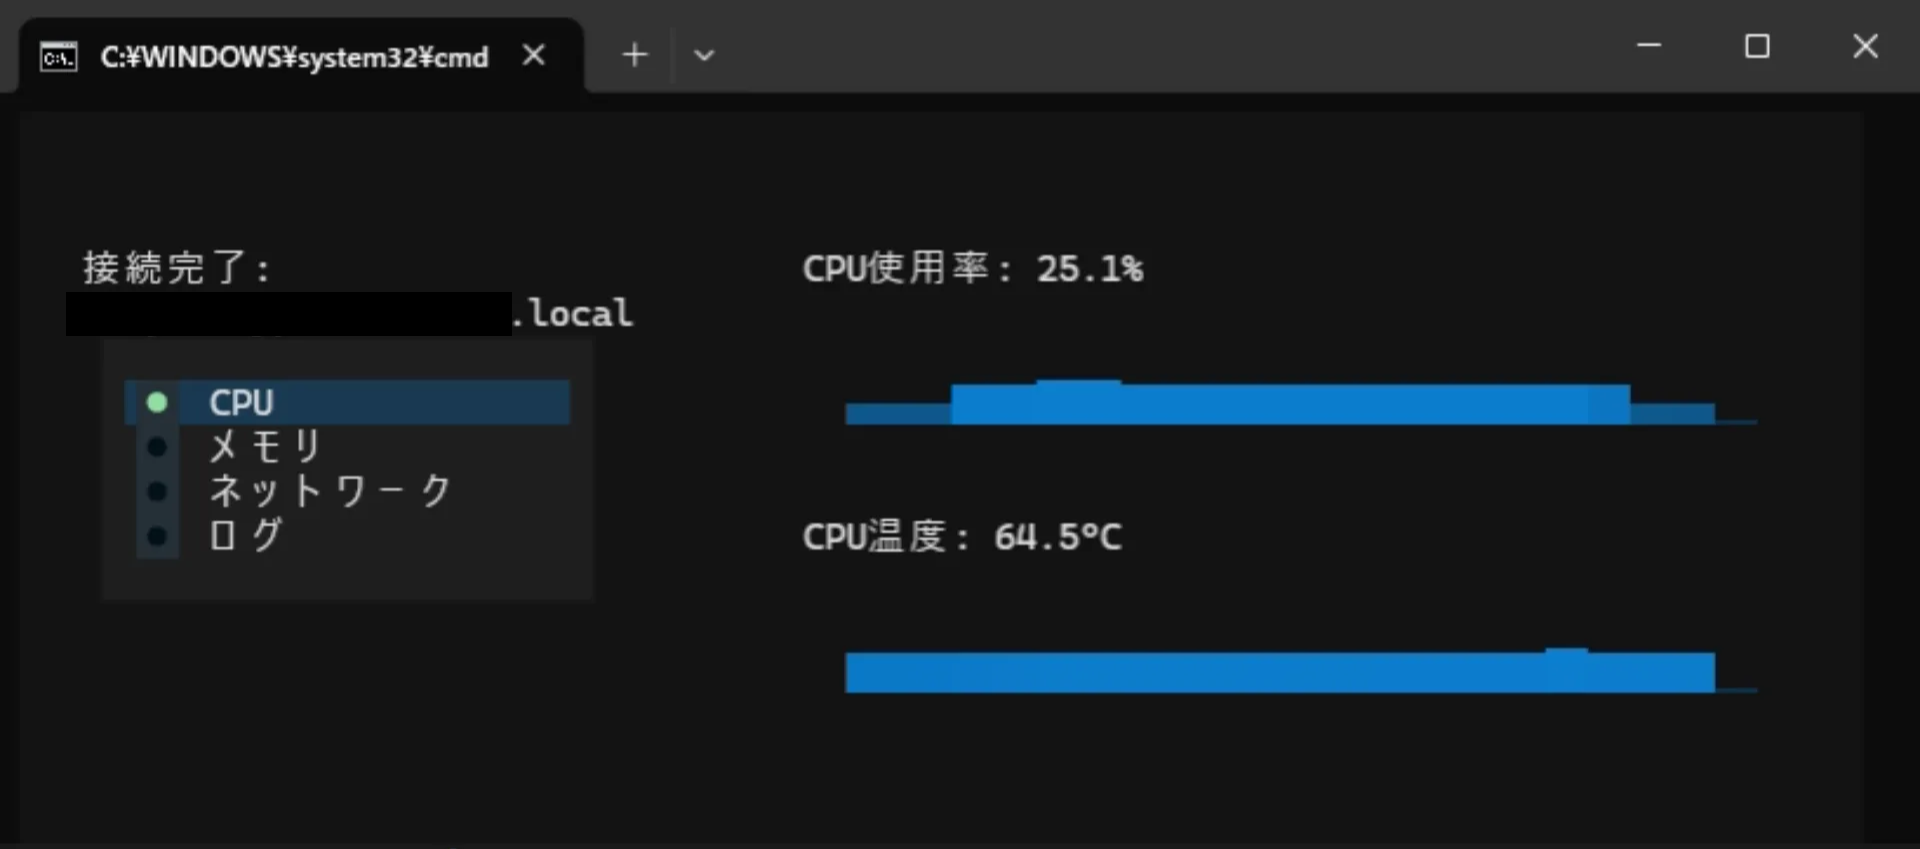
Textualでは、UIを「ウィジェット」として組み立てます。以下は主要なウィジェットの配置例です。左側にラジオボタン、右側に各情報のSparklineを表示しています。
def compose(self) -> ComposeResult:
    with Horizontal():
        with Vertical(classes="left-panel"):
            yield self.connection_label
            with RadioSet():
                yield RadioButton("CPU", value=True, id="radio_cpu")
                yield RadioButton("メモリ", id="radio_memory")
                yield RadioButton("ネットワーク", id="radio_network")
        with Vertical(classes="right-panel"):
            with Vertical(id="cpu_container"):
                yield self.cpu_usage_label
                yield self.cpu_sparkline
                yield self.cpu_temp_label
                yield self.temp_sparkline
            with Vertical(id="memory_container"):
                yield self.memory_label
                yield self.memory_sparkline
            with Vertical(id="network_container"):
                yield self.net_up_label
                yield self.net_up_sparkline
                yield self.net_down_label
                yield self.net_down_sparkline
3-5. SSH接続とデータ取得
PCからRaspberry Piへasyncsshで非同期SSH接続し、先ほどのスクリプトをリモート実行して情報を取得します。
async def monitor_system(self):
    host = HOST_NAME
    user = USER_NAME
    key_path = KEY_PATH
    try:
        async with asyncssh.connect(
            host,
            username=user,
            client_keys=[key_path],
            known_hosts=None
        ) as conn:
            self.connection_label.update(f"接続完了: {host}")
3-6. メインループとUI更新
1秒ごとにRaspberry Pi上のスクリプトを実行し、取得したデータでUIを更新します。
while True:
    try:
        result = await conn.run("python3 ~/Project/sys_info.py", check=True)
        data = json.loads(result.stdout)

        # CPU使用率
        cpu_usage = float(data.get('cpu', 0))
        self.cpu_readings.append(cpu_usage)
        self.cpu_sparkline.data = list(self.cpu_readings) + [0] # 表示調整のため0を追加
        self.cpu_usage_label.update(f"CPU使用率: {cpu_usage}%")

        # ...他の項目も同様に更新...

    except Exception as e:
        self.connection_label.update(f"データ取得エラー: {e}")

    await asyncio.sleep(1) # 更新間隔
3-7. レイアウト・スタイルの適用
最後に、レイアウトを整えて完成です。TextualはCSSライクなスタイル指定が可能で、ウィジェットにはそれぞれidとclassを設定できます。
CSS = """
Screen { align: center top; }
Sparkline { width: 100%; margin: 2; }
/* ...省略... */
"""

# または .tcss ファイルに記述し、CSS_PATHで指定
CSS_PATH = "style.tcss"
4. おわりに
Textualを用いて簡単にTUIアプリケーションを作成することができました。ドキュメントが充実していて、公式サイトやGitHubのサンプルを参考にしながら、直感的にUIを組み立てられる点がよかったです。
5. 参考にしたサイト等