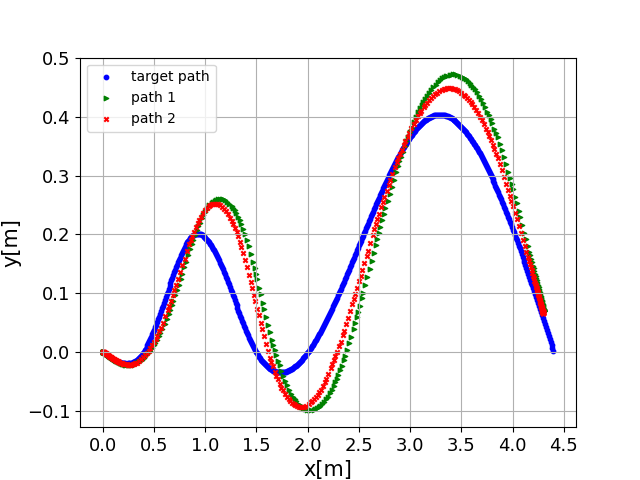
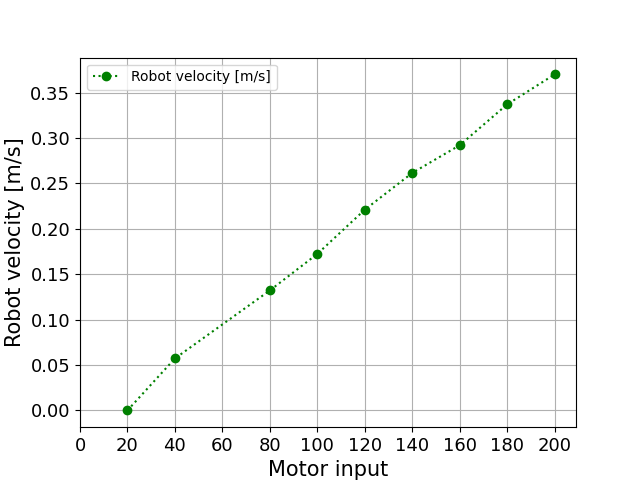
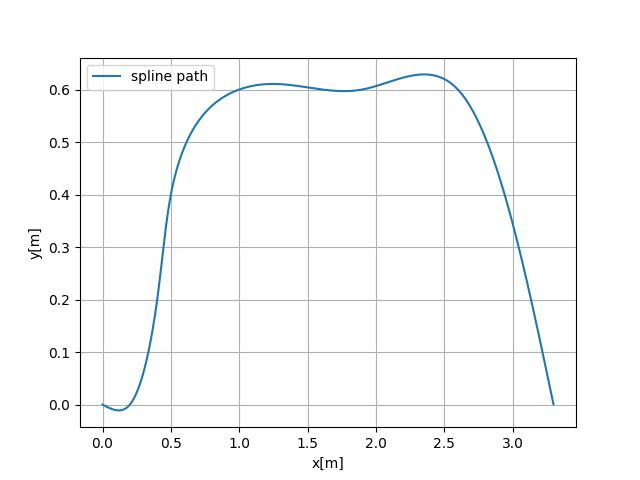
pandasで描いたグラフ
使い方
- https://github.com/renkawasumi/xlsx_python をcloneする
- show_xlsx.pyを実行する
- フォルダ内に生成されたグラフがpng画像で保存される
- make_xlsx.pyを実行する
- pythonのlistからxlsxファイルを生成する
Go to list of users who liked
More than 1 year has passed since last update.
Register as a new user and use Qiita more conveniently
Go to list of users who liked