はじめに
COVID-19の感染者の推移グラフはNHKやその他のサイトで参照できますが単一グラフです。このようなグラフは時間軸であるx軸に対して、y軸として「感染者数」、「死者数」、「要入院治療者数」、「重症者数」等を同時にグラフ化すると傾向がわかりやすくなります。
そこで、そのようなグラフをmatplotlibで作成するため、多軸(2軸~4軸)グラフ作成のプロトタイプを作成してみました。
その際、「フォントサイズ」、「多軸の数」、「多軸のスケール幅」に応じて多軸の幅をプログラムで調整しているのがこのプログラムの肝です。
プログラム
プログラムは以下の通りです。
# matplotlib 多軸(2軸~4軸)グラフ
import matplotlib as mpl
import matplotlib.pyplot as plt
import japanize_matplotlib


def main():

    x = [1, 2, 3, 4]  # ※1
    y = [[2, 3, 1, 6],
         [350, 200, 500, 100],
         [500000, 1000, 350000, 400000],
         [4000, 8000, 5000, 7000],
         ]

    assert 1 <= len(y) <= 4, "y の長さ不正"

    line_width = [0.25, 0.5, 0.75, 1.0]
    y_label = ["ラベルY0", "ラベルY1", "ラベルY2", "ラベルY3"]
    color = ["black", "orange", "blue", "red"]

    # フォントサイズ指定
    plt.rcParams["font.size"] = 8  # ※2
    font_size = plt.rcParams["font.size"]

    # 2軸以上の場合の描画軸の幅計算  # ※3
    spline_width = [0]
    [spline_width.append((len(str(int(max(y[i])))) + 3) * 9 * font_size / 10) for i in range(1, len(y))]  # ※4
    spline_pos = [0, 0]
    [spline_pos.append(sum(spline_width[:i])) for i in range(2, len(y))]

    facecolor = "pink"
    fig = plt.figure(figsize=(6.4, 3.6), facecolor=facecolor)

    figsize = mpl.rcParams["figure.figsize"]

    # 軸数に従って、プロット領域のrightを決める  ※5
    one_po = 1.0 / 72.0     # 1point = 1/72inch
    right = 0.995 - sum(spline_width) * one_po / figsize[0]
    plt.subplots_adjust(left=0.07, bottom=0.14, top=0.92, right=right)

    # 複数のax作成  ※6
    ax0 = fig.add_subplot()
    ax = [ax0]
    [ax.append(ax0.twinx()) for _ in range(1, len(y))]

    plt.title("タイトル")
    ax0.set_xlabel('ラベルX')

    # プロット  ※7
    for i in range(len(ax)):
        ax[i].plot(x, y[i], color=color[i], linewidth=line_width[i], label=y_label[i])
        ax[i].set_ylabel(y_label[i])
        right_spine = ax[i].spines['right']  # ※8
        right_spine.set_position(('outward', spline_pos[i]))

    # 凡例  ※9
    for i in range(len(y)):
        exec(f"handler{i}, label{i} = ax[i].get_legend_handles_labels()")
    handler_str, label_str = '', ''
    for i in range(len(y)):
        handler_str += (' + ' if i != 0 else '') + f"handler{i}"
        label_str += (' + ' if i != 0 else '') + f"label{i}"
    ax[0].legend(eval(handler_str), eval(label_str), loc="upper left")

    ax0.grid()

    plt.show()

    return


if __name__ == '__main__':
    main()
プログラムの説明
※1:データはこのx、yを使います。
※2:フォントサイズを指定します。matplotlibのデフォルトは10ポイントでした。
※3:多軸の描画幅を計算します。
spline_width には、各軸の幅(ポイント)が入ります。spline_width[0]は、左のy軸幅です。spline_width[1:]は、右のy軸幅です。
spline_pos は、各軸の描画位置です。spline_width を足していったものです。
※4:(len(str(int(max(y[i])))) + 3) * 9 * font_size / 10
幅を計算しています。len(str(int(max(y[i]))))は各軸の桁数を求めています。
+3の3は、それにy軸の棘(tick、1と想定)とラベル幅(2と想定)を意味しています。
font_sizeに従って幅を調整します。
この式は、経験(試験)により求めたものです。調整が必要でしょう。
※5:求めたy軸の幅から、描画域のright(左端からの割合。0~1。1は最右端)を設定します。
0.995は、単一y軸の場合に右側に少し間を空けるためです。
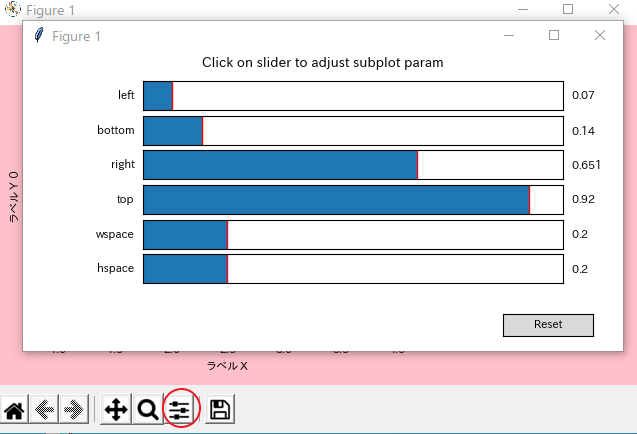
他の、left、bottom、topは表示されたグラフの「Configure subplot」で調整しながら設定するのが便利です。下図参照。
※6:各axを作成します。yは可変なのでyのデータ数分作成します。
※7:ここでplotします。
※8:y軸の位置を設定します。
set_position(('outward', spline_pos[i]))ですでに求めてあるy軸の位置を設定します。
'outward'は、右端軸からの指定を意味します。
※9:凡例の作成です。
はじめは、以下の様にしていました。
    handler, label = [], []
    for i in range(len(y)):
        h, l = ax[i].get_legend_handles_labels()
        handler.append(h)
        label.append(l)
    ax[0].legend(handler, label, loc="upper left")
けれども、これだと「UserWarning: Legend does not support [] instances.
A proxy artist may be used instead.」という警告が出るため、致し方なく、exec()とeval()を使用して警告を回避しました。
実行結果
本プログラムの実行結果です。

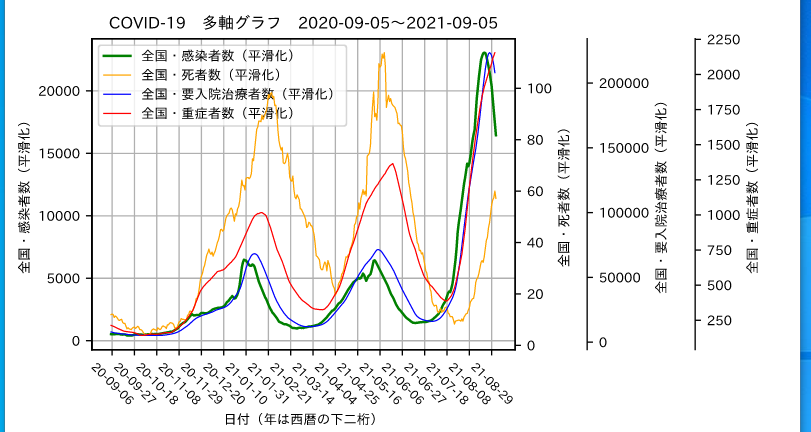
おまけ
これをもとにして、COVID-19の「感染者数」、「死者数」、「要入院治療者数」、「重症者数」の多軸グラフを作成してみました。
これは、http://covid19graph.pythonanywhere.com/ から見ることができます。
謝辞
多数のサイトを参照しました。そのサイトの方々に感謝いたします。
以上