はじめに
この記事は Slint Advent Calendar 2024 23日目の記事です。
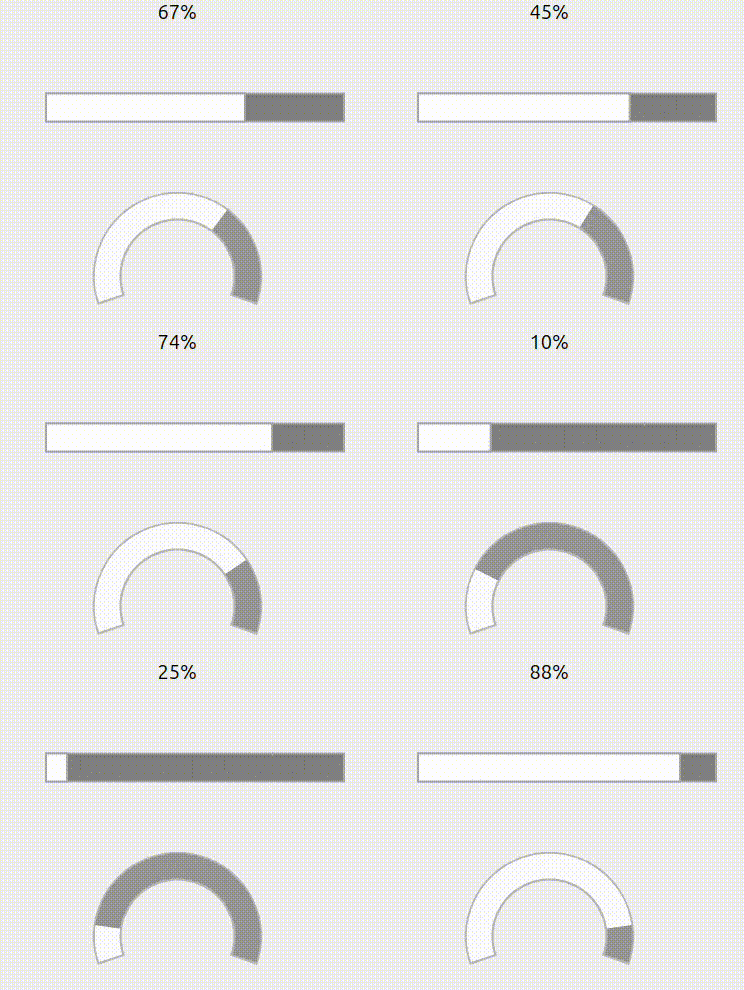
この記事では、RustとSlintを使用して、定期的に更新される動的な棒グラフ・ゲージチャートを作成する方法を解説します。
棒グラフ・ゲージチャートをSlintで作成
Rectangleを使用した方法とPathを使用した方法を思いつきました。
Rectangleを使用した方法は、長方形以外は作成不可となりますが、
Software Rendererでの実装が可能です。
Pathを使用した方法では円形・長方形以外の形も作成可能で自由度が高いですが、
Software RendererではPathがサポートされていないので実装できないです。
1. Rectangleを使用した方法
Rectangleを2つ重ねて、前にあるRectangleのwidthをprogressプロパティによって変化させています。
縦に変化させたいときはheightの値をprogressプロパティに合わせて変化させてください。
Rectangleについては公式ドキュメントを参考にしてください。
component BarGraph inherits Rectangle{
    width: 500px;
    height: 200px;
    in-out property <percent> progress:20%;

    Rectangle { //グラフの背景
        x: 90px;
        y: root.height/2;
        background: gray;
        border-color: black;
        border-width: 1px;
        width: 300px;
        height: 30px ;
    }

    Rectangle { //グラフの前部分
        x: 90px;
        y: root.height/2;
        background: white;
        border-color: black;
        border-width: 1px;
        width: 300px*progress;
        height: 30px ;
        animate width {
            duration: 1000ms;
            easing: ease-in-out;
        }
    }
}
2. Pathコンポーネントを使用した方法
SlintのIOTダッシュボードデモを参考に作成しました。
PieChartFillでドーナツのような形を描いています。
PieChartPaintedでPieChartFillを複数呼び出し、ゲージチャートを作成しています。
こちらもprogressプロパティの値で位置が変わるようになっています。
Pathについては公式ドキュメントを参考にしてください

component PieChartFill inherits Path {
    in property <float> thickness;
    in property <float> inner-radius;
    in property <float> progress;
    in property <float> start : -0.3;

    viewbox-width: 100;
    viewbox-height: 100;

    MoveTo {
        y: 50 - 50 * cos(-root.start * 360deg);
        x: 50 - 50 * sin(-root.start * 360deg);
    }

    LineTo {
        y: 50 - root.inner-radius * cos(-root.start * 360deg);
        x: 50 - root.inner-radius * sin(-root.start * 360deg);

    }

    ArcTo {
        radius-x: root.inner-radius;
        radius-y: root.inner-radius;
        y: 50 - root.inner-radius*cos(-(root.start + root.progress) * 360deg);
        x: 50 - root.inner-radius*sin(-(root.start + root.progress) * 360deg);
        sweep: root.progress > 0;
        large-arc: root.progress > 0.5;

    }

    LineTo {
        y: 50 - 50*cos(-(root.start + root.progress) * 360deg);
        x: 50 - 50*sin(-(root.start + root.progress) * 360deg);
    }

    ArcTo {
        radius-x: 50;
        radius-y: 50;
        y: 50 - 50 * cos(-root.start * 360deg);
        x: 50 - 50 * sin(-root.start * 360deg);
        sweep: root.progress < 0;
        large-arc: root.progress > 0.5;
    }

    LineTo {
        y: 50 - 50 * cos(-root.start * 360deg);
        x: 50 - 50 * sin(-root.start * 360deg);
    }
}

component PieChartPainted inherits Rectangle {
    in property <percent> progress:40%;
    in property <float> thickness: 15;
    in property <float> inner-radius: 50 - root.thickness;
    opacity: 0.8;

    mostback := PieChartFill {//外枠
    fill:#A9A9A9;
    width: 100%;
    height: 100%;
    inner-radius: 33;
    progress: 0.61;
    start: -0.305;
    }

    back := PieChartFill {//背景
        fill:gray;
        width: 98%;
        height: 98%;
        thickness: root.thickness;
        inner-radius: root.inner-radius;
        progress: 0.6;
    }

    p := PieChartFill {//前の部分
        fill: white;
        width: 98%;
        height: 98%;
        thickness: root.thickness;
        inner-radius: root.inner-radius;
        progress: root.progress * 0.6;
        animate progress {
            duration: 800ms;
        }
    }
}
おまけに2種類のグラフを1画面でだせるように呼び出しました。
export component Main inherits Window  {
    in property <percent> progress:30%;
    VerticalLayout {
        Text {text: progress*100 + "%"; font-size: 20px; x: root.width/2-20px;}
        BarGraph {progress: progress;}
        PieChartPainted {progress: progress;}
    }
}
グラフの値の設定
1. グラフの値の設定/更新方法
Slintで定義したプロパティ値を取得・変更したい場合は次のようにします。
特に意味はありませんが、get関数で取得した値を同じプロパティにset関数で入れ直しています。
ちなみに、Mainコンポーネントが表示される前にこの処理が行われます。
詳細については公式ドキュメントを参考にしてください。
fn main() {
    let main = Main::new().unwrap(); //Mainコンポーネントをインスタンス化

    let value = main.get_progress();//progressプロパティのget関数
    main.set_progress(value);//progressプロパティのset関数

    main.run().unwrap();/*最初に show() を呼び出して画面を表示させ、イベントループをまわる関数
                         イベントループから外れるときはHide()を呼び出して画面を隠す。*/
}
2. 一定周期で呼び出されるイベントの作成方法
一定周期でイベントを呼び出す場合はTimerを使用します。
詳細は公式ドキュメントを参考にしてください。
ランダムな数値をグラフで表示させたいので、randクレートを使ってget_random_integer関数を作成しました。
use slint::{Timer,TimerMode};
use rand::prelude::*;
slint::include_modules!();

fn main() {
    let main = Main::new().unwrap();
    let main_weak = main.as_weak();//弱い参照
    let timer = Timer::default();

    /*2秒ごとにイベントを呼び出している*/
    timer.start(TimerMode::Repeated, core::time::Duration::from_millis(2000), move||{
        //ここにイベント内の処理を記載する
        let main_weak=main_weak.upgrade().unwrap();
        let next_progress = get_random_integer(100.0,0.0) ;
        main_weak.set_progress(next_progress);
    });

    main.run().unwrap();
}

fn get_random_integer(max:f32,min:f32)->f32{ //ランダムな値を返す
    let mut rng = rand::thread_rng();
    let value=rng.gen_range(min..=max);
    value.floor()
}
終わりに
今回は、定期的に動く棒グラフ・ゲージチャートを作成してみました。
誰かの参考になれば幸いです。

