はじめに
社内で情報を共有するにあたって、Google Sitesは手軽でデザイン性も高く、非技術者にも利用しやすいツールです。
しかし、画像としてダイアグラムを Google Sites に埋め込むのではなく、ダイアグラムをテキストファイルから動的に画像を生成して埋め込む機能を持たせようとすると、これは意外と高いハードルになります。
Redmine や Github、JIRA のようなサービスで Mermaid などを使いダイアグラムをテキストベースで作成し、履歴管理しつつ情報共有しているエンジニアは視点からすると、Google Sites でも同様の方式を実現したい。
そこで、Google Apps Script (GAS)と D2.js (WASM)のみを用いて、特別なバックエンドサーバーを使わずに、完全にクライアントのみで D2 のダイアグラムを描画する手段を検討します。
特徴
- サーバー不要・GASとブラウザだけで完結し、インフラ管理ゼロ
- Google Workspaceと自然に連携し、共有・認証・履歴管理が簡単
- D2.jsでリアルタイム描画、シートやAPIから動的に図を生成可能
ゴール
今回のゴールはテキストファイルでダイアグラムを表現し、そのファイルを Google Drive に保存しておけば、そのダイアグラムを Google Site に埋め込んで表示することです。
次の図は、D2 の公式サイトにあるサンプルのダイアグラムデータを GAS で HTML として出力し、ウェブブラウザで表示させたものになります。

D2/D2.js とは
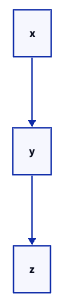
D2 は、簡潔なテキストベースの構文でダイアグラム(フローチャートやシステム構成図など)を記述できる宣言的言語です。たとえば、x -> y のように記述するだけで、ノード x と y を矢印でつなぐ図が生成されます
次のようにコマンドをインストールして、svg形式でダイアグラムを出力することができます。
First, install D2
curl -fsSL https://d2lang.com/install.sh | sh -s --

echo 'x -> y -> z' > in.d2
d2 --watch in.d2 out.svg
出力結果:
D2.js は、D2 の描画エンジンを WebAssembly (WASM) 化し、JavaScript から呼び出せるようにしたブラウザ向けライブラリです。
Webブラウザだけで D2 の構文を解釈し、SVG ダイアグラムを生成することが可能になります。npm パッケージとして提供されているだけでなく、CDN(Content Delivery Network)経由で読み込んでウェブサイトに埋め込むことができます。
WASM で動作するため、外部サーバーに依存せず高速描画できるのが特長です。D2.js を使えば、サーバー側の処理なしにウェブブラウザで動的な図の表示ができるため、GASとの組み合わせにも相性がよい。
プロジェクト作成手順
-
GAS プロジェクトを新規作成
- Apps Script エディタで「新しいプロジェクト」を選択
-
Code.gsを追加Code.gsfunction doGet() { return HtmlService.createHtmlOutputFromFile('index'); } -
index.htmlを追加(次章参照) -
[デプロイ] → [ウェブアプリ]
- 「新しいデプロイ」「アクセスを全員」に設定し URL を取得
- これでブラウザからアクセス可能
GAS と D2.js で実現する Web ダイアグラム表示
1. ダイアグラムを表現したファイルを用意
公式サイトのサンプルコードをGAS と D2.js で表示させる。sample.d2 ファイルとして Google Drive に保存する。
vars: {
d2-config: {
layout-engine: elk
# Terminal theme code
theme-id: 300
}
}
network: {
cell tower: {
satellites: {
shape: stored_data
style.multiple: true
}
transmitter
satellites -> transmitter: send
satellites -> transmitter: send
satellites -> transmitter: send
}
online portal: {
ui: {shape: hexagon}
}
data processor: {
storage: {
shape: cylinder
style.multiple: true
}
}
cell tower.transmitter -> data processor.storage: phone logs
}
user: {
shape: person
width: 130
}
user -> network.cell tower: make call
user -> network.online portal.ui: access {
style.stroke-dash: 3
}
api server -> network.online portal.ui: display
api server -> logs: persist
logs: {shape: page; style.multiple: true}
network.data processor -> api server
2. GASの設定
Code.gsファイルとindex.htmlファイルの2つを用意してWebアプリとしてデプロイする
Google Driveから sample.d2 を取得して、その内容を index.html ファイルで読み込む
function doGet() {
  return HtmlService.createHtmlOutputFromFile('index');
}
function getD2Code() {
const files = DriveApp.getFilesByName("sample.d2");
if (files.hasNext()) {
const file = files.next();
return file.getBlob().getDataAsString();
} else {
return "x -> y\ny -> z\nx: Missing\ny: Sample\nz: File";
}
}
sample.d2 を Drive から読み込み D2.js で描画する
<!DOCTYPE html>
<html>
  <head>
    <base target="_top">
    <meta charset="UTF-8">
    <title>D2.js in GAS</title>
    <style>
      body { font-family: sans-serif; padding: 1em; }
      #diagram svg { border: 1px solid #ccc; margin-top: 1em; width: 100%; }
    </style>
  </head>
  <body>
    <div id="diagram">Loading...</div>
    <script type="module">
      import { D2 } from 'https://esm.sh/@terrastruct/d2@0.1.23';
      const d2 = new D2();

      async function renderDiagram(d2code) {
        const result = await d2.compile(d2code);
        const svg = await d2.render(result.diagram, result.renderOptions);
        document.getElementById("diagram").innerHTML = svg;
      }

      // GASの関数からD2コードを取得
      google.script.run.withSuccessHandler(renderDiagram).getD2Code();
    </script>
  </body>
</html>
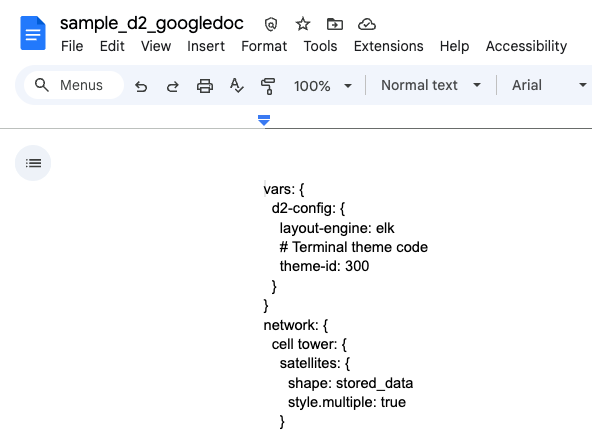
Google Docs でダイアグラムを管理する場合
Google Docs 形式のファイルでデータを管理したい場合には、スクリプト部分を次のように変更します。
function doGet() {
  return HtmlService.createHtmlOutputFromFile('index');
}

function getD2Code() {
  const files = DriveApp.getFilesByName("sample_d2_googledoc");
  if (files.hasNext()) {
    const file = files.next();
    const doc = DocumentApp.openById(file.getId()); // DriveのファイルIDを使ってドキュメントを開く
    return doc.getBody().getText(); // 本文のテキストを取得
  } else {
    return "x -> y\ny -> z\nx: Missing\ny: Sample\nz: File";
  }
}
3. 確認
GASでデプロイしたURLにブラウザでアクセスして動的に描画されるダイアグラムを確認する
Google Driveに保存した sample.d2 にテキストで表現したダイアグラムをブラウザで動的に描画できることを確認した。sample.d2 の内容を更新すれば、再読み込み時にダイアグラムも更新される。
まとめ
これで、動的にテキストファイルから生成するダイアグラムを Google Site に埋め込むことが可能となった。
今後は表示したダイアグラムをインライン編集する機能をステップバイステップで追加していく。