北陽電機の測域センサ「UTM-30LX」をpythonで動かしたのでメモ。
pythonnでURG動かないかな…と思って探してみたらいい感じのライブラリを見つけたので使ってみました。
とりあえずソースコード
Test_LRF_v1.py
import pyurg
import matplotlib.pyplot as plt
import time

def draw():
   urg = pyurg.Urg()
   urg.set_urg('COM5')
   plt.ion()
   axis = plt.gca()
   while True:
      status = urg.request_me(0,1080,num = 1)
      urg.check_status(status)
      dist, intensity, timestamp = urg.get_distance_and_intensity()
      x,y = urg.convert_to_x_y(dist)
      plt.plot(x,y)
      plt.draw()
      axis.clear()
      time.sleep(0.01)

if __name__=="__main__":
   draw()
とりあえず表示するだけでそこから先は特に何もなしってかんじです。
import pyurg
import matplotlib.pyplot as plt
import time
ライブラリのインポートです。
pyurg(URG使うため)
matplotlib(グラフに描画)
time(スリープのため)
def draw():
   urg = pyurg.Urg()
   urg.set_urg('COM5')
   plt.ion()
   axis = plt.gca()
   while True:
      status = urg.request_me(0,1080,num = 1)
      urg.check_status(status)
      dist, intensity, timestamp = urg.get_distance_and_intensity()
      x,y = urg.convert_to_x_y(dist)
      plt.plot(x,y)
      plt.draw()
      axis.clear()
      time.sleep(0.01)
urgはCOM5に接続しています。
plt.ion()でインタラクティブモードに入ります。
status = urg.request_me(0,1080,num = 1)
urgへMEモードで計測要求をリクエストします。(この場合step0-1080までを1回計測)
urg.get_distance_and_intensity()
でデータを受け取り、
urg.convert_to_x_y(dist)
でx,yのデータに変換します。
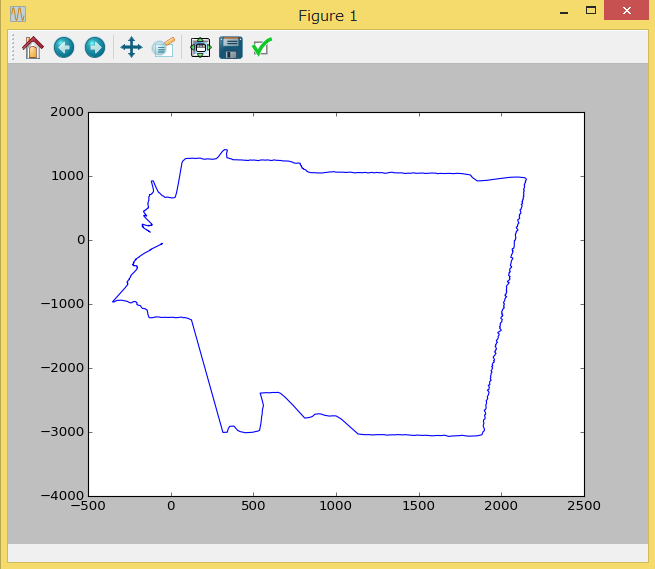
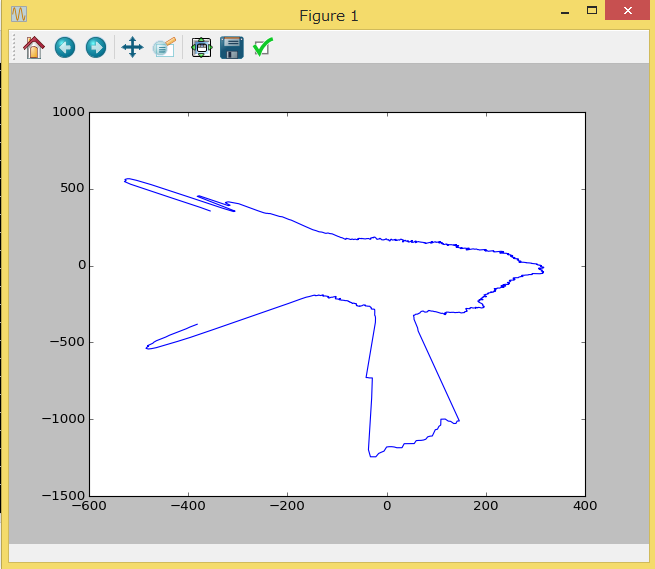
あとはplotしてdrawすればグラフを表示してくれます。
whileで無限ループを作っているので時系列でデータを更新しながら表示できます。
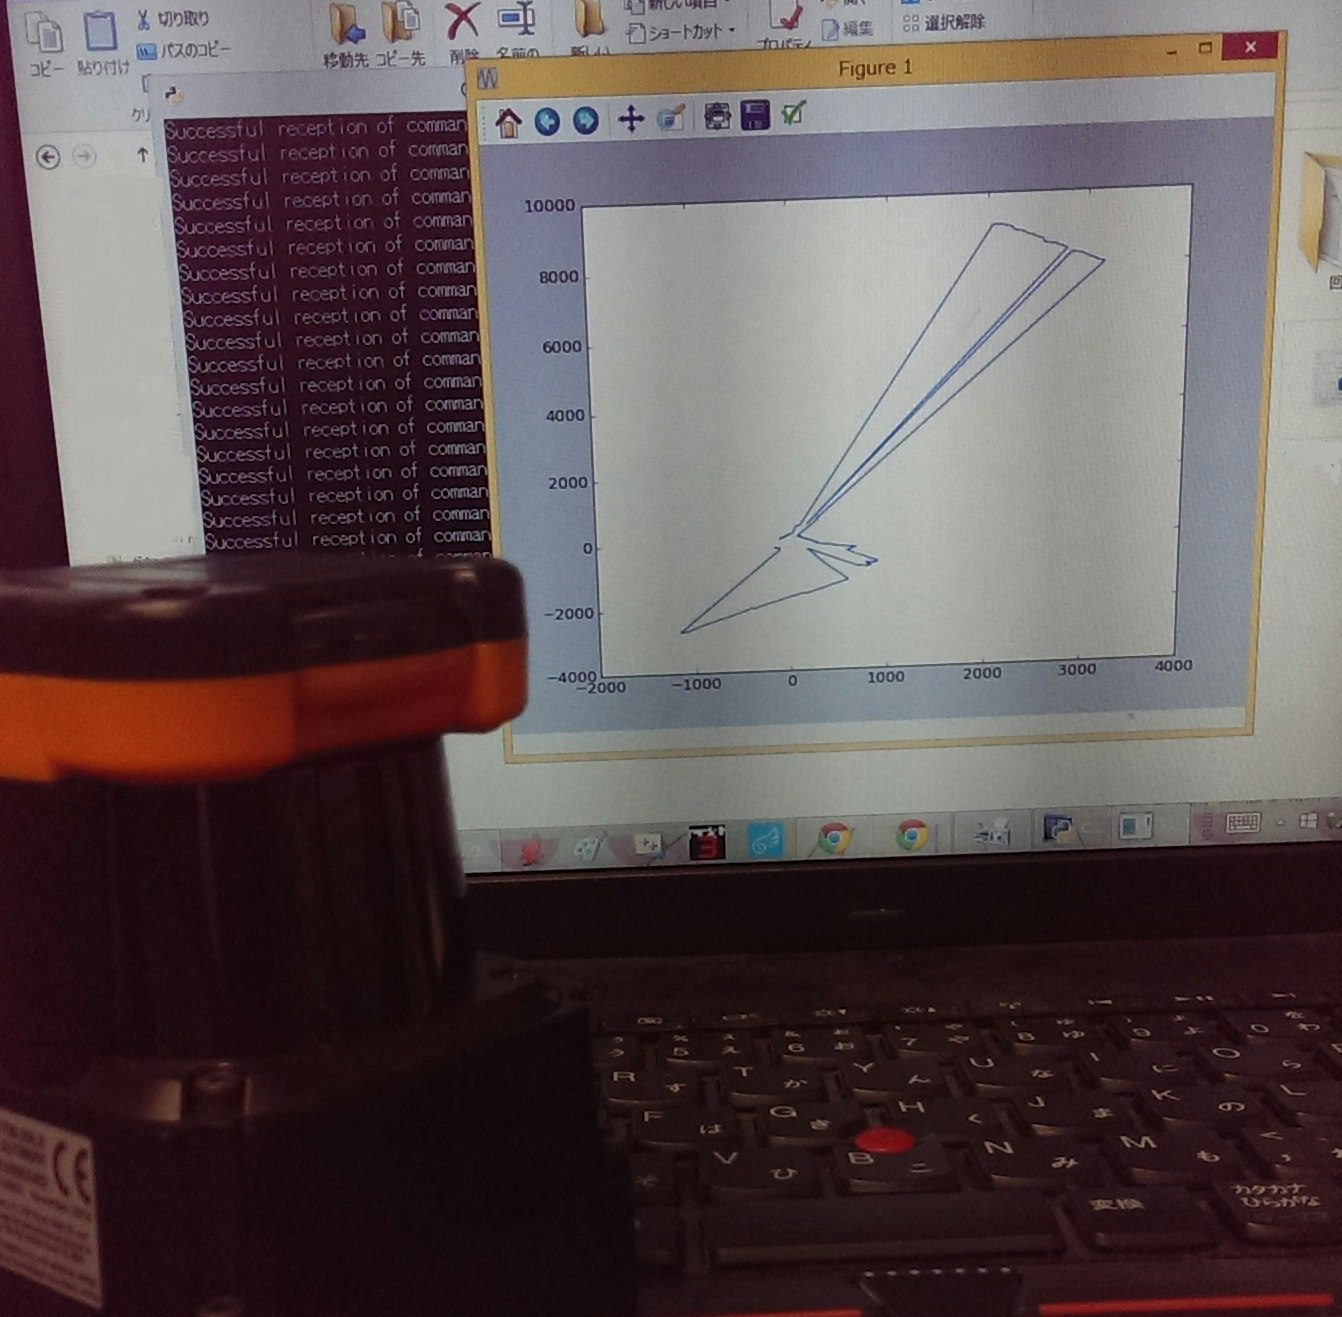
こんな感じで動きます。