import numpy as np
import matplotlib.pyplot as plt
from scipy.signal import windows

# パラメータ設定
Fs = 20000   # サンプリング周波数
L = 10000    # 信号の長さ
Freq = 99    # 信号の周波数

# 時間ベクトル
t = np.arange(0, L) / Fs
f = Fs * np.arange(0, L//2 + 1) / L
n = len(f)  # 周波数ベクトルの長さ

# 純粋な信号の生成
pure = np.sin(2 * np.pi * Freq * t)

# 1次デルタシグマ変調器
dac = 0           # 初期DAC値
sigma = 0         # 初期シグマレジスタ値
comp1_out = np.zeros(L)

for i in range(L):
    delta = pure[i] - dac
    sigma += delta
    if sigma > 0:
        dac = 1
        comp1_out[i] = 1
    else:
        dac = -1
        comp1_out[i] = -1

# 2次デルタシグマ変調器
dac = 0           # 初期DAC値
sigma1 = 0        # 初期1次シグマレジスタ値
sigma2 = 0        # 初期2次シグマレジスタ値
comp2_out = np.zeros(L)

for i in range(L):
    delta1 = pure[i] - dac
    sigma1 += delta1
    delta2 = sigma1 - dac
    sigma2 += delta2
    if sigma2 > 0:
        dac = 1
        comp2_out[i] = 1
    else:
        dac = -1
        comp2_out[i] = -1

# 窓関数
win = windows.hann(L)

# スペクトルの計算
pure_sp = np.abs(np.fft.fft(pure * win))
pdm1_sp = np.abs(np.fft.fft(comp1_out * win))
pdm2_sp = np.abs(np.fft.fft(comp2_out * win))

# プロット
fig, axs = plt.subplots(3, 2, figsize=(12, 8))

# 純粋な信号のプロット
axs[0, 0].plot(t, pure)
axs[0, 0].grid(True)
axs[0, 0].set_title("Pure signal", fontsize=10)
axs[0, 0].set_ylabel("Amplitude", fontsize=10)
axs[0, 0].set_xlim([0, 1/Freq])
axs[0, 0].set_ylim([-1.2, 1.2])

# 1次デルタシグマのプロット
axs[1, 0].plot(t, comp1_out)
axs[1, 0].grid(True)
axs[1, 0].set_title("1st order delta-sigma", fontsize=10)
axs[1, 0].set_ylabel("Amplitude", fontsize=10)
axs[1, 0].set_xlim([0, 1/Freq])
axs[1, 0].set_ylim([-1.2, 1.2])

# 2次デルタシグマのプロット
axs[2, 0].plot(t, comp2_out)
axs[2, 0].grid(True)
axs[2, 0].set_title("2nd order delta-sigma", fontsize=10)
axs[2, 0].set_xlabel("Time [s]", fontsize=10)
axs[2, 0].set_ylabel("Amplitude", fontsize=10)
axs[2, 0].set_xlim([0, 1/Freq])
axs[2, 0].set_ylim([-1.2, 1.2])

# スペクトルのプロット
axs[0, 1].plot(f, 20 * np.log10(pure_sp[:n]), label="Pure signal")
axs[0, 1].set_title("Spectrum", fontsize=10)
axs[0, 1].set_xlabel("Freq [Hz]", fontsize=10)
axs[0, 1].set_ylabel("Amplitude [dB]", fontsize=10)
axs[0, 1].set_xlim([1, Fs/2])
axs[0, 1].set_ylim([-80, np.max(20 * np.log10(pure_sp))])
axs[0, 1].grid(True)

axs[1, 1].plot(f, 20 * np.log10(pdm1_sp[:n]), label="1st order", color='orange')
axs[1, 1].set_title("1st order delta-sigma Spectrum", fontsize=10)
axs[1, 1].set_xlabel("Freq [Hz]", fontsize=10)
axs[1, 1].set_ylabel("Amplitude [dB]", fontsize=10)
axs[1, 1].set_xlim([1, Fs/2])
axs[1, 1].set_ylim([-80, np.max(20 * np.log10(pure_sp))])
axs[1, 1].grid(True)

axs[2, 1].plot(f, 20 * np.log10(pdm2_sp[:n]), label="2nd order", color='green')
axs[2, 1].set_title("2nd order delta-sigma Spectrum", fontsize=10)
axs[2, 1].set_xlabel("Freq [Hz]", fontsize=10)
axs[2, 1].set_ylabel("Amplitude [dB]", fontsize=10)
axs[2, 1].set_xlim([1, Fs/2])
axs[2, 1].set_ylim([-80, np.max(20 * np.log10(pure_sp))])
axs[2, 1].grid(True)

# レイアウト調整
plt.tight_layout()
plt.show()
import numpy as np
import matplotlib.pyplot as plt
from scipy.signal import windows

# パラメータ設定
Fs = 20000   # サンプリング周波数
L = 10000    # 信号の長さ
Freq = 99    # 信号の周波数

# 時間ベクトル
t = np.arange(0, L) / Fs
f = Fs * np.arange(0, L//2 + 1) / L
n = len(f)  # 周波数ベクトルの長さ

# 純粋な信号の生成
pure = np.sin(2 * np.pi * Freq * t)

# デルタシグマ変調器
dac = 0           # 初期DAC値
sigma = 0         # 初期シグマレジスタ値
comp_out = np.zeros(L)

for i in range(L):
    delta = pure[i] - dac
    sigma += delta
    if sigma > 0:
        dac = 1
        comp_out[i] = 1
    else:
        dac = -1
        comp_out[i] = -1

# 窓関数
win = windows.hann(L)

# スペクトルの計算
pure_sp = np.abs(np.fft.fft(pure * win))
pdm_sp = np.abs(np.fft.fft(comp_out * win))

# プロット
fig, axs = plt.subplots(1, 2, figsize=(12, 6))

# 時間領域でのプロット
axs[0].plot(t, pure, label="Pure signal")
axs[0].plot(t, comp_out, label="PDM", linestyle='--')
axs[0].legend(loc="upper right")
axs[0].grid(True)
axs[0].set_title("Time domain", fontsize=10)
axs[0].set_xlabel("Time [s]", fontsize=10)
axs[0].set_ylabel("Amplitude", fontsize=10)
axs[0].set_xlim([0, 1/Freq])
axs[0].set_ylim([-1.5, 1.5])

# 周波数領域でのプロット
axs[1].plot(f, 20 * np.log10(pure_sp[:n]), label="Pure signal")
axs[1].plot(f, 20 * np.log10(pdm_sp[:n]), label="PDM", linestyle='--')
axs[1].legend(loc="lower right")
axs[1].grid(True)
axs[1].set_title("Spectrum", fontsize=10)
axs[1].set_xlabel("Freq [Hz]", fontsize=10)
axs[1].set_ylabel("Amplitude [dB]", fontsize=10)
axs[1].set_xlim([1, Fs/2])
axs[1].set_ylim([-80, np.max(20 * np.log10(pure_sp))])

# レイアウト調整
plt.tight_layout()
plt.show()
import numpy as np
import matplotlib.pyplot as plt
from scipy.signal import windows

# パラメータ設定
Fs = 20000   # サンプリング周波数
L = 10000    # 信号の長さ
Freq = 99    # 信号の周波数

# 時間ベクトル
t = np.arange(L) / Fs
f = Fs * np.arange(0, L//2 + 1) / L
n = len(f)  # 周波数ベクトルの長さ

# 純粋な信号の生成
pure = np.sin(2 * np.pi * Freq * t)

# 1ビットデルタシグマ変調器
dac = 0
sigma_out = 0
comp1_out = np.zeros(L)

for i in range(L):
    delta_out = pure[i] - dac
    sigma_out += delta_out
    if sigma_out > 0:
        dac = 1
        comp1_out[i] = 1
    else:
        dac = -1
        comp1_out[i] = -1

# 2ビットデルタシグマ変調器
dac = 0
sigma_out = 0
comp2_out = np.zeros(L)

for i in range(L):
    delta_out = pure[i] - dac
    sigma_out += delta_out
    if sigma_out > 1/3:
        dac = 1
        comp2_out[i] = 1
    elif sigma_out >= 0:
        dac = 1/3
        comp2_out[i] = 1/3
    elif sigma_out >= -1/3:
        dac = -1/3
        comp2_out[i] = -1/3
    else:
        dac = -1
        comp2_out[i] = -1

# 窓関数
win = windows.hann(L)

# スペクトルの計算
pure_sp = np.abs(np.fft.fft(pure * win))
pdm1_sp = np.abs(np.fft.fft(comp1_out * win))
pdm2_sp = np.abs(np.fft.fft(comp2_out * win))

# プロット設定
fig, axs = plt.subplots(3, 1, figsize=(12, 15))

# 純粋な信号のスペクトル
axs[0].plot(f, 20 * np.log10(pure_sp[:n]), color='blue')
axs[0].set_title("Spectrum of Pure Signal", fontsize=10)
axs[0].set_xlabel("Freq [Hz]", fontsize=10)
axs[0].set_ylabel("Amplitude [dB]", fontsize=10)
axs[0].grid(True)
axs[0].set_xlim([1, Fs/2])
axs[0].set_ylim([-80, np.max(20 * np.log10(pure_sp))])

# 1ビットデルタシグマのスペクトル
axs[1].plot(f, 20 * np.log10(pdm1_sp[:n]), color='green')
axs[1].set_title("Spectrum of 1-bit Delta-Sigma", fontsize=10)
axs[1].set_xlabel("Freq [Hz]", fontsize=10)
axs[1].set_ylabel("Amplitude [dB]", fontsize=10)
axs[1].grid(True)
axs[1].set_xlim([1, Fs/2])
axs[1].set_ylim([-80, np.max(20 * np.log10(pure_sp))])

# 2ビットデルタシグマのスペクトル
axs[2].plot(f, 20 * np.log10(pdm2_sp[:n]), color='red')
axs[2].set_title("Spectrum of 2-bit Delta-Sigma", fontsize=10)
axs[2].set_xlabel("Freq [Hz]", fontsize=10)
axs[2].set_ylabel("Amplitude [dB]", fontsize=10)
axs[2].grid(True)
axs[2].set_xlim([1, Fs/2])
axs[2].set_ylim([-80, np.max(20 * np.log10(pure_sp))])

plt.tight_layout()
plt.show()
import numpy as np
import matplotlib.pyplot as plt
from scipy.signal import windows

# パラメータ設定
Fs = 20000   # サンプリング周波数
L = 10000    # 信号の長さ
Freq = 99    # 信号の周波数

# 時間ベクトル
t = np.arange(L) / Fs
f = Fs * np.arange(0, L//2 + 1) / L
n = len(f)  # 周波数ベクトルの長さ

# 純粋な信号の生成
pure = np.sin(2 * np.pi * Freq * t)

# 1次デルタシグマ変調器
dac = 0
sigma = 0
comp1_out = np.zeros(L)

for i in range(L):
    delta = pure[i] - dac
    sigma += delta
    if sigma > 0:
        dac = 1
        comp1_out[i] = 1
    else:
        dac = -1
        comp1_out[i] = -1

# 2次デルタシグマ変調器
dac = 0
sigma1 = 0
sigma2 = 0
comp2_out = np.zeros(L)

for i in range(L):
    delta1 = pure[i] - dac
    sigma1 += delta1
    delta2 = sigma1 - dac
    sigma2 += delta2
    if sigma2 > 0:
        dac = 1
        comp2_out[i] = 1
    else:
        dac = -1
        comp2_out[i] = -1

# 窓関数
win = windows.hann(L)

# スペクトルの計算
pure_sp = np.abs(np.fft.fft(pure * win))
pdm1_sp = np.abs(np.fft.fft(comp1_out * win))
pdm2_sp = np.abs(np.fft.fft(comp2_out * win))

# プロット設定
fig, axs = plt.subplots(3, 2, figsize=(12, 15))

# 純粋な信号のプロット
axs[0, 0].plot(t, pure)
axs[0, 0].grid(True)
axs[0, 0].set_title("Pure signal", fontsize=10)
axs[0, 0].set_ylabel("Amplitude", fontsize=10)
axs[0, 0].set_xlim([0, 1/Freq])
axs[0, 0].set_ylim([-1.2, 1.2])

# 1次デルタシグマのプロット
axs[1, 0].plot(t, comp1_out)
axs[1, 0].grid(True)
axs[1, 0].set_title("1st order delta-sigma", fontsize=10)
axs[1, 0].set_ylabel("Amplitude", fontsize=10)
axs[1, 0].set_xlim([0, 1/Freq])
axs[1, 0].set_ylim([-1.2, 1.2])

# 2次デルタシグマのプロット
axs[2, 0].plot(t, comp2_out)
axs[2, 0].grid(True)
axs[2, 0].set_title("2nd order delta-sigma", fontsize=10)
axs[2, 0].set_xlabel("Time [s]", fontsize=10)
axs[2, 0].set_ylabel("Amplitude", fontsize=10)
axs[2, 0].set_xlim([0, 1/Freq])
axs[2, 0].set_ylim([-1.2, 1.2])

# 純粋な信号のスペクトルのプロット
axs[0, 1].plot(f, 20 * np.log10(pure_sp[:n]), color='blue')
axs[0, 1].set_title("Spectrum of Pure Signal", fontsize=10)
axs[0, 1].set_xlabel("Freq [Hz]", fontsize=10)
axs[0, 1].set_ylabel("Amplitude [dB]", fontsize=10)
axs[0, 1].grid(True)
axs[0, 1].set_xlim([1, Fs/2])
axs[0, 1].set_ylim([-80, np.max(20 * np.log10(pure_sp))])

# 1次デルタシグマのスペクトルのプロット
axs[1, 1].plot(f, 20 * np.log10(pdm1_sp[:n]), color='green')
axs[1, 1].set_title("Spectrum of 1st Order Delta-Sigma", fontsize=10)
axs[1, 1].set_xlabel("Freq [Hz]", fontsize=10)
axs[1, 1].set_ylabel("Amplitude [dB]", fontsize=10)
axs[1, 1].grid(True)
axs[1, 1].set_xlim([1, Fs/2])
axs[1, 1].set_ylim([-80, np.max(20 * np.log10(pure_sp))])

# 2次デルタシグマのスペクトルのプロット
axs[2, 1].plot(f, 20 * np.log10(pdm2_sp[:n]), color='red')
axs[2, 1].set_title("Spectrum of 2nd Order Delta-Sigma", fontsize=10)
axs[2, 1].set_xlabel("Freq [Hz]", fontsize=10)
axs[2, 1].set_ylabel("Amplitude [dB]", fontsize=10)
axs[2, 1].grid(True)
axs[2, 1].set_xlim([1, Fs/2])
axs[2, 1].set_ylim([-80, np.max(20 * np.log10(pure_sp))])

plt.tight_layout()
plt.show()
import numpy as np
import matplotlib.pyplot as plt
from scipy.signal import freqz

def ds(M):
    # デルタシグマ変調器のノイズ伝達関数を作成
    b = [1]
    a = [1] + [0] * M + [-1]
    return b, a

# 周波数応答を取得するための関数
def get_freq_response(M, worN=512):
    b, a = ds(M)
    w, h = freqz(b, a, worN=worN, fs=1)
    return w, h

# 周波数応答を計算
w1, h1 = get_freq_response(1)
w2, h2 = get_freq_response(2)
w3, h3 = get_freq_response(3)

# グラフ作成
fig, axs = plt.subplots(1, 3, figsize=(15, 5))

# プロット1: ノイズ伝達特性のゲイン
axs[0].plot(w1, 20 * np.log10(np.abs(h1)), '-o', label='1st')
axs[0].plot(w2, 20 * np.log10(np.abs(h2)), '-s', label='2nd')
axs[0].plot(w3, 20 * np.log10(np.abs(h3)), '-^', label='3rd')
axs[0].legend(loc='lower right')
axs[0].grid()
axs[0].set_xlabel('Normalized Frequency [Hz]')
axs[0].set_ylabel('Gain [dB]')
axs[0].set_xlim([0, 0.5])
axs[0].set_ylim([-60, 20])

# プロット2: ノイズ伝達特性の詳細(低周波数部分)
axs[1].plot(w1, 20 * np.log10(np.abs(h1)), '-o', label='1st')
axs[1].plot(w2, 20 * np.log10(np.abs(h2)), '-s', label='2nd')
axs[1].plot(w3, 20 * np.log10(np.abs(h3)), '-^', label='3rd')
axs[1].legend(loc='lower right')
axs[1].set_title('Delta-sigma noise spectrum')
axs[1].grid()
axs[1].set_xlabel('Normalized Frequency [Hz]')
axs[1].set_ylabel('Gain [dB]')
axs[1].set_xlim([1e-4, 0.5])
axs[1].set_ylim([-60, 20])

# プロット3: ノイズエネルギー
axs[2].plot(w1, np.abs(h1)**2, '-o', label='1st')
axs[2].plot(w2, np.abs(h2)**2, '-s', label='2nd')
axs[2].plot(w3, np.abs(h3)**2, '-^', label='3rd')
axs[2].legend(loc='lower right')
axs[2].grid()
axs[2].set_xlabel('Normalized Frequency [Hz]')
axs[2].set_ylabel('Noise Energy [a.u.]')
axs[2].set_xlim([0, 0.5])
axs[2].set_ylim([0, 4])

plt.tight_layout()
plt.show()
import numpy as np
import matplotlib.pyplot as plt
from scipy.fft import fft, fftfreq

# Parameters
Fs = 1000  # Sample frequency
L = 1000   # Length of signal
Freq = 49  # Signal frequency
B = 8      # Bit resolution

# Time and frequency vectors
t = np.arange(0, L) / Fs
f = fftfreq(L, 1/Fs)
n = len(f) // 2  # Length of frequency vector

# Pure signal
pure = np.sin(2 * np.pi * Freq * t) * (2**B)
# Quantized signal
qzd = np.round(pure)
# Quantization error
err = pure - qzd

# Compute FFT
def compute_fft(signal):
    window = np.hanning(L)
    return np.abs(fft(signal * window))

pure_sp = compute_fft(pure)
qzd_sp = compute_fft(qzd)
err_sp = compute_fft(err)

# Peak detection
peak = np.max(20 * np.log10(pure_sp))

# Plotting
fig, axs = plt.subplots(1, 3, figsize=(18, 6))

# Pure signal spectrum
axs[0].plot(f[:n], 20 * np.log10(pure_sp[:n]) - peak)
axs[0].set_title("Pure signal spectrum", fontsize=14)
axs[0].set_xlabel("Freq [Hz]", fontsize=12)
axs[0].set_ylabel("Amplitude [dB]", fontsize=12)
axs[0].grid(True)
axs[0].set_xlim([0, Fs/2])
axs[0].set_ylim([-180, 0])

# Quantized signal spectrum
axs[1].plot(f[:n], 20 * np.log10(qzd_sp[:n]) - peak)
axs[1].set_title("Quantized signal spectrum", fontsize=14)
axs[1].set_xlabel("Freq [Hz]", fontsize=12)
axs[1].set_ylabel("Amplitude [dB]", fontsize=12)
axs[1].grid(True)
axs[1].set_xlim([0, Fs/2])
axs[1].set_ylim([-200, 0])

# Quantized noise spectrum
axs[2].plot(f[:n], 20 * np.log10(err_sp[:n]) - peak)
axs[2].set_title("Quantized noise spectrum", fontsize=14)
axs[2].set_xlabel("Freq [Hz]", fontsize=12)
axs[2].set_ylabel("Amplitude [dB]", fontsize=12)
axs[2].grid(True)
axs[2].set_xlim([0, Fs/2])
axs[2].set_ylim([-200, 0])

plt.tight_layout()
plt.show()
import numpy as np
import matplotlib.pyplot as plt
from scipy.fft import fft, fftfreq

# Parameters
Fs = 20000  # Sample frequency
L = 10000   # Length of signal
Freq = 99   # Signal frequency

# Time and frequency vectors
t = np.arange(0, L) / Fs
f = fftfreq(L, 1/Fs)
n = len(f) // 2  # Length of frequency vector

# Pure signal
pure = np.sin(2 * np.pi * Freq * t)

# Quantized signals
qzd8 = np.round(pure * 2**8)
qzd16 = np.round(pure * 2**16)
qzd24 = np.round(pure * 2**24)

# Compute FFT
def compute_fft(signal):
    window = np.hanning(L)
    return np.abs(fft(signal * window))

qzd8_sp = compute_fft(qzd8)
qzd16_sp = compute_fft(qzd16)
qzd24_sp = compute_fft(qzd24)

# Peak detection
peak8 = np.max(20 * np.log10(qzd8_sp))
peak16 = np.max(20 * np.log10(qzd16_sp))
peak24 = np.max(20 * np.log10(qzd24_sp))

# Plotting
plt.figure(figsize=(10, 6))

plt.plot(f[:n], 20 * np.log10(qzd8_sp[:n]) - peak8, label="8 bits")
plt.plot(f[:n], 20 * np.log10(qzd16_sp[:n]) - peak16, label="16 bits")
plt.plot(f[:n], 20 * np.log10(qzd24_sp[:n]) - peak24, label="24 bits")

plt.legend(loc='upper right')
plt.grid(True)
plt.title("Quantized signal spectrum", fontsize=14)
plt.xlabel("Freq [Hz]", fontsize=12)
plt.ylabel("Amplitude [dB]", fontsize=12)
plt.xlim([1, Fs/2])
plt.ylim([-200, 20])
plt.tight_layout()

plt.show()
import numpy as np
import matplotlib.pyplot as plt
from scipy.fft import fft, fftfreq

# Parameters
fs = 1e6  # Sampling frequency
T = 1.0 / fs  # Sampling interval
N = 100000  # Number of samples
f_signal = 1e3  # Signal frequency

# Time vector
t = np.linspace(0.0, N * T, N, endpoint=False)

# Input signal: A simple sine wave
x = 0.5 * np.sin(2 * np.pi * f_signal * t)

# Delta-Sigma Modulator (2nd Order)
y1 = np.zeros(N)
y2 = np.zeros(N)
v = np.zeros(N)

for n in range(1, N):
    y1[n] = y1[n-1] + x[n] - v[n-1]
    y2[n] = y2[n-1] + y1[n] - v[n-1]
    v[n] = 1 if y2[n] >= 0 else -1

# Compute FFT of the output signal
yf = fft(v)
xf = fftfreq(N, T)[:N//2]

# Plot the input and output signals
plt.figure(figsize=(12, 6))
plt.subplot(2, 1, 1)
plt.plot(t[:1000], x[:1000], label='Input Signal')
plt.plot(t[:1000], v[:1000], label='Delta-Sigma Output')
plt.title('Time Domain Signals')
plt.xlabel('Time [s]')
plt.ylabel('Amplitude')
plt.legend()

# Plot the spectrum of the output signal
plt.subplot(2, 1, 2)
plt.plot(xf, 2.0/N * np.abs(yf[:N//2]))
plt.title('Frequency Spectrum of Delta-Sigma Output')
plt.xlabel('Frequency [Hz]')
plt.ylabel('Amplitude')
plt.grid()
plt.show()
import numpy as np
import matplotlib.pyplot as plt
from scipy.fft import fft, fftfreq

# Parameters
fs = 1e6  # Sampling frequency
T = 1.0 / fs  # Sampling interval
N = 100000  # Number of samples
f_signal = 1e3  # Signal frequency

# Time vector
t = np.linspace(0.0, N * T, N, endpoint=False)

# Input signal: A simple sine wave
x = 0.5 * np.sin(2 * np.pi * f_signal * t)

# Delta-Sigma Modulator (1st Order)
y = np.zeros(N)
v = np.zeros(N)
for n in range(1, N):
    y[n] = y[n-1] + x[n] - v[n-1]
    v[n] = 1 if y[n] >= 0 else -1

# Compute FFT of the output signal
yf = fft(v)
xf = fftfreq(N, T)[:N//2]

# Plot the input and output signals
plt.figure(figsize=(12, 6))
plt.subplot(2, 1, 1)
plt.plot(t[:1000], x[:1000], label='Input Signal')
plt.plot(t[:1000], v[:1000], label='Delta-Sigma Output')
plt.title('Time Domain Signals')
plt.xlabel('Time [s]')
plt.ylabel('Amplitude')
plt.legend()

# Plot the spectrum of the output signal
plt.subplot(2, 1, 2)
plt.plot(xf, 2.0/N * np.abs(yf[:N//2]))
plt.title('Frequency Spectrum of Delta-Sigma Output')
plt.xlabel('Frequency [Hz]')
plt.ylabel('Amplitude')
plt.grid()
plt.show()
import numpy as np
import matplotlib.pyplot as plt
# パラメータ設定
T = 1 # 周期
fs = 1 / T # サンプリング周波数
t = np.arange(0, 100, T) # 時間軸
A = np.sin(2 * np.pi * t / 10) # 入力アナログサイン信号
# 量子化の設定
N = 8 # ビット数
quantization_levels = 2**N # 量子化レベル
quantization_step = 2 / quantization_levels # 量子化ステップ
A_max = 1 # サイン波の最大振幅
A_min = -1 # サイン波の最小振幅
# 量子化関数
def quantize(signal, step):
quantized_signal = np.round((signal - A_min) / step) * step + A_min
quantized_signal = np.clip(quantized_signal, A_min, A_max)
return quantized_signal
# 初期誤差Eの設定
E = np.zeros_like(A) # 初期誤差はゼロ
# A+EをAD変換してaを得る
A_E = A + E
a = quantize(A_E, quantization_step)
# aをDA変換してbを得る(量子化後の値をそのまま使う)
b = a
# (A-E) - bで量子化誤差を求める
B = (A - E) - b
# Bを周期T遅らせる
C = np.roll(B, 1)
C[0] = 0 # 初期条件設定
# C+D=Eの計算
D = np.roll(E, 1)
D[0] = 0 # 初期条件設定
E = C + D
# プロット
plt.figure(figsize=(12, 12))
plt.subplot(4, 2, 1)
plt.plot(t, A, label='A: Input Signal')
plt.xlim(0, 100)
plt.legend()
plt.grid()
plt.subplot(4, 2, 2)
plt.plot(t, A_E, label='A+E: Input Signal with Error')
plt.xlim(0, 100)
plt.legend()
plt.grid()
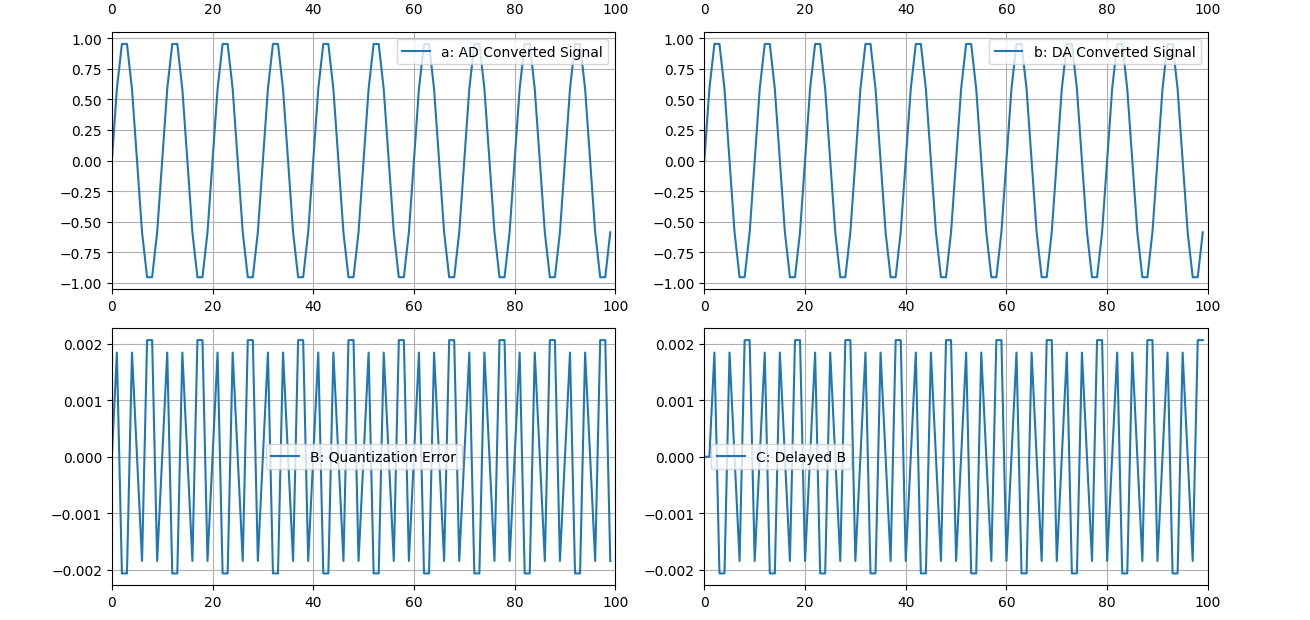
plt.subplot(4, 2, 3)
plt.plot(t, a, label='a: AD Converted Signal')
plt.xlim(0, 100)
plt.legend()
plt.grid()
plt.subplot(4, 2, 4)
plt.plot(t, b, label='b: DA Converted Signal')
plt.xlim(0, 100)
plt.legend()
plt.grid()
plt.subplot(4, 2, 5)
plt.plot(t, B, label='B: Quantization Error')
plt.xlim(0, 100)
plt.legend()
plt.grid()
plt.subplot(4, 2, 6)
plt.plot(t, C, label='C: Delayed B')
plt.xlim(0, 100)
plt.legend()
plt.grid()
plt.subplot(4, 2, 7)
plt.plot(t, E, label='E: Error Signal')
plt.xlim(0, 100)
plt.legend()
plt.grid()
plt.tight_layout()
plt.show()
import numpy as np
import matplotlib.pyplot as plt

def first_order_delta_sigma(input_signal):
    """
    Simulates a first-order delta-sigma modulator.

    Parameters:
    input_signal (numpy array): The input signal to the modulator.

    Returns:
    numpy array: The output signal of the first-order delta-sigma modulator.
    """
    n = len(input_signal)
    y = np.zeros(n)
    e = 0

    for i in range(n):
        e += input_signal[i] - y[i-1] if i > 0 else input_signal[i]
        y[i] = np.round(e)

    return y

def second_order_delta_sigma(input_signal):
    """
    Simulates a second-order delta-sigma modulator.

    Parameters:
    input_signal (numpy array): The input signal to the modulator.

    Returns:
    numpy array: The output signal of the second-order delta-sigma modulator.
    """
    n = len(input_signal)
    y = np.zeros(n)
    e1 = 0
    e2 = 0

    for i in range(n):
        e1 += input_signal[i] - y[i-1] if i > 0 else input_signal[i]
        e2 += e1
        y[i] = np.round(e2)

    return y

def plot_spectrum(signal, fs, title):
    """
    Plots the spectrum of a signal.

    Parameters:
    signal (numpy array): The input signal.
    fs (int): Sampling frequency.
    title (str): The title of the plot.
    """
    n = len(signal)
    f = np.fft.fftfreq(n, d=1/fs)
    spectrum = np.fft.fft(signal)
    magnitude = np.abs(spectrum) / n
    magnitude = magnitude[:n//2]
    f = f[:n//2]

    # Avoid log of zero by adding a small value to magnitude
    magnitude += 1e-12

    plt.figure(figsize=(12, 6))
    plt.semilogx(f, 20 * np.log10(magnitude))
    plt.xlabel('Frequency [Hz]')
    plt.ylabel('Magnitude [dB]')
    plt.title(title)
    plt.grid(which='both', linestyle='--')
    plt.show()

# Example usage
fs = 10000  # Sampling frequency
f = 100  # Signal frequency
t = np.arange(0, 1, 1/fs)  # Time vector
input_signal = np.sin(2 * np.pi * f * t)  # Sine wave input

output_signal_first_order = first_order_delta_sigma(input_signal)
output_signal_second_order = second_order_delta_sigma(input_signal)

# Plot the input signal
plt.figure(figsize=(12, 6))
plt.plot(t, input_signal)
plt.xlabel('Time [s]')
plt.ylabel('Amplitude')
plt.title('Input Signal')
plt.grid()
plt.show()

# Plot the first-order delta-sigma modulator output signal
plt.figure(figsize=(12, 6))
plt.plot(t, output_signal_first_order)
plt.xlabel('Time [s]')
plt.ylabel('Amplitude')
plt.title('First-Order Delta-Sigma Modulator Output Signal')
plt.grid()
plt.show()

# Plot the second-order delta-sigma modulator output signal
plt.figure(figsize=(12, 6))
plt.plot(t, output_signal_second_order)
plt.xlabel('Time [s]')
plt.ylabel('Amplitude')
plt.title('Second-Order Delta-Sigma Modulator Output Signal')
plt.grid()
plt.show()

# Plot the spectrum of the input signal
plot_spectrum(input_signal, fs, 'Input Signal Spectrum')

# Plot the spectrum of the first-order delta-sigma modulator output signal
plot_spectrum(output_signal_first_order, fs, 'First-Order Delta-Sigma Modulator Output Signal Spectrum')

# Plot the spectrum of the second-order delta-sigma modulator output signal
plot_spectrum(output_signal_second_order, fs, 'Second-Order Delta-Sigma Modulator Output Signal Spectrum')
import matplotlib.pyplot as plt
import numpy as np
from scipy.fft import fft
from scipy.signal import windows

# Define parameters
N = 16384  # Number of points
fs = 1000  # Sampling frequency in Hz
f_input = 50  # Frequency of input sine wave in Hz
n = np.arange(N)

# Generate input analog sine wave
analog_signal = 0.3 * np.sin(2 * np.pi * f_input * n / fs)

# Initialize variables
quantization_error = np.random.choice([-1, 1], size=N)
A = np.zeros_like(n)
B = np.zeros_like(n)
C = np.zeros_like(n)
output_signal = np.zeros_like(n)

# Perform the ADC process
for i in range(1, N):
    B[i] = analog_signal[i] + A[i]
    C[i] = C[i-1] + B[i]  # Numerical integration
    output_signal[i] = C[i] + quantization_error[i]  # Adding quantization error
    if i < N - 1:
        A[i+1] = output_signal[i]  # Feedback with 1 sample delay

# Apply window to the output signal before FFT
window = windows.hann(N)
output_signal_windowed = output_signal * window

# Perform FFT
V = fft(output_signal_windowed)

# Calculate frequency axis
f = np.linspace(0, fs, N, endpoint=False)
f_norm = f / fs  # Normalized frequency axis (Fin/Fs)

# Calculate power spectral density in dBFS
V_dBFS = 20 * np.log10(np.abs(V) / np.max(np.abs(V)))

# Plot the waveforms
plt.figure(figsize=(12, 8))

plt.subplot(4, 1, 1)
plt.plot(n, analog_signal, label='Analog Signal')
plt.title('Analog Signal')
plt.xlabel('Sample')
plt.ylabel('Amplitude')
plt.legend()
plt.grid()

plt.subplot(4, 1, 2)
plt.plot(n, B, label='B Signal')
plt.title('B Signal (Analog + Feedback)')
plt.xlabel('Sample')
plt.ylabel('Amplitude')
plt.legend()
plt.grid()

plt.subplot(4, 1, 3)
plt.plot(n, output_signal, label='Output Signal')
plt.title('Output Signal')
plt.xlabel('Sample')
plt.ylabel('Amplitude')
plt.legend()
plt.grid()

plt.subplot(4, 1, 4)
plt.plot(f_norm[:N // 2], V_dBFS[:N // 2], label='Noise Shaped Quantization Spectrum')
plt.title('Noise Shaped Quantization Spectrum')
plt.xlabel('Normalized Frequency (Fin/Fs)')
plt.ylabel('Power (dBFS)')
plt.legend()
plt.grid()

plt.tight_layout()
plt.show()
import numpy as np
import matplotlib.pyplot as plt
from scipy.signal import lfilter

# パラメータ設定
Fs = 1000  # サンプリング周波数
T = 1.0    # シミュレーション時間
t = np.linspace(0, T, int(Fs*T), endpoint=False)  # 時間軸
f = 5      # 入力信号の周波数
A = 0.5    # 入力信号の振幅

# アナログ入力信信号生成
input_signal = A * np.sin(2 * np.pi * f * t)

# デルタシグマADCの初期化
integrator = 0
delta_output = np.zeros_like(input_signal)
integrator_output = np.zeros_like(input_signal)
output = np.zeros_like(input_signal)
feedback_signal = np.zeros_like(input_signal)

# デルタシグマADCのシミュレーション
for i in range(len(input_signal)):
    delta_output[i] = input_signal[i] - (feedback_signal[i-1] if i > 0 else 0)
    integrator += delta_output[i]
    integrator_output[i] = integrator
    output[i] = 1 if integrator > 0 else -1
    feedback_signal[i] = output[i]

# デジタルフィルタの適用(移動平均フィルタ)
N = 10  # フィルタのタップ数
b = np.ones(N) / N
filtered_output = lfilter(b, 1, output)

# FFTの計算
fft_output = np.fft.fft(output)
fft_filtered_output = np.fft.fft(filtered_output)
frequencies = np.fft.fftfreq(len(t), 1/Fs)

# 結果のプロット
plt.figure(figsize=(12, 12))

# アナログ入力信号のプロット
plt.subplot(6, 1, 1)
plt.plot(t, input_signal, label='Input Signal')
plt.title('Analog Input Signal')
plt.xlabel('Time [s]')
plt.ylabel('Amplitude')
plt.grid()
plt.legend()

# デルタ変調器の出力信号のプロット
plt.subplot(6, 1, 2)
plt.plot(t, delta_output, label='Delta Output')
plt.title('Delta Modulator Output Signal')
plt.xlabel('Time [s]')
plt.ylabel('Amplitude')
plt.grid()
plt.legend()

# 積分器の出力信号のプロット
plt.subplot(6, 1, 3)
plt.plot(t, integrator_output, label='Integrator Output')
plt.title('Integrator Output Signal')
plt.xlabel('Time [s]')
plt.ylabel('Amplitude')
plt.grid()
plt.legend()

# デジタル出力信号のプロット
plt.subplot(6, 1, 4)
plt.plot(t, output, label='Output Signal')
plt.title('Delta-Sigma ADC Output Signal')
plt.xlabel('Time [s]')
plt.ylabel('Output')
plt.grid()
plt.legend()

# フィードバック信号のプロット
plt.subplot(6, 1, 5)
plt.plot(t, feedback_signal, label='Feedback Signal')
plt.title('Feedback Signal')
plt.xlabel('Time [s]')
plt.ylabel('Amplitude')
plt.grid()
plt.legend()

# フィルタ適用後のFFTプロット
plt.subplot(6, 1, 6)
plt.plot(frequencies[:len(frequencies)//2], np.abs(fft_output)[:len(frequencies)//2], label='Output FFT')
plt.plot(frequencies[:len(frequencies)//2], np.abs(fft_filtered_output)[:len(frequencies)//2], label='Filtered Output FFT')
plt.title('FFT of Output and Filtered Output')
plt.xlabel('Frequency [Hz]')
plt.ylabel('Magnitude')
plt.grid()
plt.legend()

plt.tight_layout()
plt.show()
import numpy as np
import matplotlib.pyplot as plt

def delta_sigma_modulation(signal, oversample_rate):
    """
    Delta-Sigma modulation.

    Parameters:
    signal (np.array): Input signal to be modulated
    oversample_rate (int): Oversampling rate

    Returns:
    np.array: Modulated signal
    """
    # Oversample the input signal
    oversampled_signal = np.repeat(signal, oversample_rate)

    # Initialize variables
    n = len(oversampled_signal)
    modulated_signal = np.zeros(n)
    integrator = 0
    quantized = 0

    # Delta-Sigma modulation loop
    for i in range(n):
        integrator += oversampled_signal[i] - quantized
        if integrator >= 0:
            quantized = 1
        else:
            quantized = -1
        modulated_signal[i] = quantized

    return modulated_signal

def generate_signal(frequency, sampling_rate, duration):
    """
    Generate a sine wave signal.

    Parameters:
    frequency (float): Frequency of the sine wave
    sampling_rate (float): Sampling rate
    duration (float): Duration of the signal in seconds

    Returns:
    np.array: Generated sine wave signal
    """
    t = np.arange(0, duration, 1 / sampling_rate)
    signal = np.sin(2 * np.pi * frequency * t)
    return signal

# Parameters
frequency = 1.0  # Frequency of the sine wave
sampling_rate = 100.0  # Original sampling rate
oversample_rate = 16  # Oversampling rate
duration = 1.0  # Duration in seconds

# Generate input signal
input_signal = generate_signal(frequency, sampling_rate, duration)

# Perform Delta-Sigma modulation
modulated_signal = delta_sigma_modulation(input_signal, oversample_rate)

# Plot the results
plt.figure(figsize=(12, 6))

# Plot original signal
plt.subplot(2, 1, 1)
plt.plot(np.linspace(0, duration, len(input_signal)), input_signal, label='Original Signal')
plt.title('Original Signal')
plt.xlabel('Time [s]')
plt.ylabel('Amplitude')
plt.legend()

# Plot modulated signal
plt.subplot(2, 1, 2)
plt.plot(np.linspace(0, duration, len(modulated_signal)), modulated_signal, label='Delta-Sigma Modulated Signal')
plt.title('Delta-Sigma Modulated Signal')
plt.xlabel('Time [s]')
plt.ylabel('Amplitude')
plt.legend()

plt.tight_layout()
plt.show()
import numpy as np
import scipy.signal as signal
import matplotlib.pyplot as plt

# 設定
TW = 0.08  # Transition Width
Astop = 59  # Stopband Attenuation (dB)
N = 91      # Filter order (number of taps)

# Kaiserウィンドウ設計
def kaiser_fir_filter(TW, Astop, N):
    beta = signal.kaiser_beta(Astop)  # Kaiser window beta parameter
    fir_coeff = signal.firwin(N, TW, window=('kaiser', beta), pass_zero=False)
    return fir_coeff

# 初期設計(浮動小数点フィルター)
fir_coeff = kaiser_fir_filter(TW, Astop, N)
w, h = signal.freqz(fir_coeff)

# 固定小数点フィルターの設計
def quantize_filter(coeffs, bits):
    scale = 2**(bits - 1)
    q_coeffs = np.round(coeffs * scale) / scale
    return q_coeffs

# 量子化されたフィルターの設計
fixed_bits = 16
quantized_coeff = quantize_filter(fir_coeff, fixed_bits)

# 周波数応答のプロット
plt.figure(figsize=(12, 6))
plt.subplot(2, 1, 1)
plt.plot(w / np.pi, 20 * np.log10(np.abs(h)), 'b', label='Floating Point')
plt.title('Frequency Response of Floating Point Filter')
plt.xlabel('Normalized Frequency')
plt.ylabel('Magnitude (dB)')
plt.grid(True)
plt.legend()

# 固定小数点フィルターの周波数応答
w_q, h_q = signal.freqz(quantized_coeff)
plt.subplot(2, 1, 2)
plt.plot(w_q / np.pi, 20 * np.log10(np.abs(h_q)), 'r', label='Quantized')
plt.title('Frequency Response of Quantized Filter')
plt.xlabel('Normalized Frequency')
plt.ylabel('Magnitude (dB)')
plt.grid(True)
plt.legend()

plt.tight_layout()
plt.show()

# ノイズシェーピング(簡略化版)
def noise_shaping_filter(coeffs, bits, trials=10):
    best_coeff = None
    best_attenuation = -np.inf
    for _ in range(trials):
        q_coeffs = quantize_filter(coeffs, bits)
        w_q, h_q = signal.freqz(q_coeffs)
        attenuation = 20 * np.log10(np.min(np.abs(h_q)))
        if attenuation > best_attenuation:
            best_attenuation = attenuation
            best_coeff = q_coeffs
    return best_coeff, best_attenuation

# ノイズシェーピングフィルターの設計
optimized_coeff, attenuation = noise_shaping_filter(fir_coeff, 13)
print(f'Best Stopband Attenuation: {attenuation:.2f} dB')

# 最適化されたフィルターの周波数応答
w_opt, h_opt = signal.freqz(optimized_coeff)
plt.figure(figsize=(12, 6))
plt.plot(w_opt / np.pi, 20 * np.log10(np.abs(h_opt)), 'g', label='Optimized')
plt.title('Frequency Response of Optimized Filter')
plt.xlabel('Normalized Frequency')
plt.ylabel('Magnitude (dB)')
plt.grid(True)
plt.legend()
plt.show()
import numpy as np
import matplotlib.pyplot as plt
from scipy.signal import lfilter, freqz

# パラメータの設定
fs = 1e6  # サンプリング周波数 [Hz]
oversampling_factor = 64
fs_os = fs * oversampling_factor  # オーバーサンプリング後の周波数 [Hz]
G2 = 4  # フィルタのゲイン

# 入力信号の設定
t = np.arange(0, 1, 1/fs)  # 1秒間のサンプル
x = 0.5 * np.sin(2 * np.pi * 1e3 * t)  # 1kHzのサイン波

# 1次ΔΣ変調器の設計
def delta_sigma_modulator(x, fs, oversampling_factor):
    # オーバーサンプリング
    x_os = np.repeat(x, oversampling_factor)

    # ΔΣ変調器のフィルタ係数
    a = 0.99

    # ΔΣ変調器の内部状態
    y = np.zeros_like(x_os)
    e = np.zeros_like(x_os)

    # ΔΣ変調器の動作
    for i in range(1, len(x_os)):
        e[i] = x_os[i] - y[i-1]
        y[i] = a * y[i-1] + np.sign(e[i])

    # ダウンサンプリング
    y_ds = y[::oversampling_factor]
    return y_ds, e

# MASH0-1型ΔΣ変調器の設計
def mash01_modulator(x, fs, oversampling_factor, G2):
    # オーバーサンプリング
    x_os = np.repeat(x, oversampling_factor)

    # ΔΣ変調器のフィルタ係数
    a = 0.99
    b = 0.99

    # ΔΣ変調器の内部状態
    y1 = np.zeros_like(x_os)
    y2 = np.zeros_like(x_os)
    e1 = np.zeros_like(x_os)
    e2 = np.zeros_like(x_os)

    # 1段目のΔΣ変調器
    for i in range(1, len(x_os)):
        e1[i] = x_os[i] - y1[i-1]
        y1[i] = a * y1[i-1] + np.sign(e1[i])

    # 2段目のΔΣ変調器
    for i in range(1, len(x_os)):
        e2[i] = -e1[i] + e2[i-1]/G2
        y2[i] = b * y2[i-1] + np.sign(e2[i])

    # ダウンサンプリング
    y_ds = y2[::oversampling_factor]
    return y_ds

# 1次ΔΣ変調器とMASH0-1型ΔΣ変調器の実行
y1_ds, e = delta_sigma_modulator(x, fs, oversampling_factor)
y2_ds = mash01_modulator(x, fs, oversampling_factor, G2)

# 周波数ドメインの表示
def plot_spectrum(signal, fs, title):
    n = len(signal)
    f = np.fft.fftfreq(n, 1/fs)
    spectrum = np.fft.fft(signal)
    plt.figure(figsize=(10, 6))
    plt.plot(f[:n//2], 20 * np.log10(np.abs(spectrum[:n//2])), 'b-')
    plt.title(title)
    plt.xlabel('Frequency [Hz]')
    plt.ylabel('Power [dB]')
    plt.grid()
    plt.show()

# 入力信号のスペクトル表示
plot_spectrum(x, fs, 'Input Signal Spectrum')

# 1次ΔΣ変調器出力信号のスペクトル表示
plot_spectrum(y1_ds, fs, '1st Order ΔΣ Modulator Output Spectrum')

# MASH0-1型ΔΣ変調器出力信号のスペクトル表示
plot_spectrum(y2_ds, fs, 'MASH0-1 ΔΣ Modulator Output Spectrum')
import numpy as np
import matplotlib.pyplot as plt
from scipy.signal import butter, lfilter, welch

# パラメータ設定
Fs = 10000  # サンプリング周波数 [Hz]
T = 1.0 / Fs  # サンプリング周期 [s]
N = 1000  # サンプル数
t = np.linspace(0.0, N*T, N, endpoint=False)  # 時間ベクトル

# 入力信号の生成
freq = 50  # 信号の周波数 [Hz]
x = 0.5 * np.sin(2 * np.pi * freq * t)  # アナログ信号

# ディザの追加
def apply_dither(signal, dither_amount=0.01):
    noise = np.random.uniform(-dither_amount, dither_amount, size=len(signal))
    return signal + noise

# 量子化(ディザを適用する前の量子化)
def quantize(signal, n_bits):
    levels = 2**n_bits
    quantized_signal = np.round(signal * (levels - 1)) / (levels - 1)
    return quantized_signal

# ディザを適用して量子化
n_bits = 8
dither_amount = 0.01
dithered_signal = apply_dither(x, dither_amount)
quantized_signal = quantize(dithered_signal, n_bits)

# ノイズシェーピング(単純な積分器を使用)
def noise_shaping(signal, beta=0.9):
    noise = np.zeros(len(signal))
    output_signal = np.zeros(len(signal))
    for i in range(1, len(signal)):
        noise[i] = signal[i] - output_signal[i-1]
        output_signal[i] = beta * output_signal[i-1] + noise[i]
    return output_signal

# ノイズシェーピングの適用
shaped_signal = noise_shaping(quantized_signal)

# フィルタリング(ローパスフィルタを適用)
def butter_lowpass_filter(data, cutoff, fs, order=5):
    nyq = 0.5 * fs
    normal_cutoff = cutoff / nyq
    b, a = butter(order, normal_cutoff, btype='low', analog=False)
    y = lfilter(b, a, data)
    return y

# ローパスフィルタのパラメータ
cutoff_freq = 100  # カットオフ周波数 [Hz]
filtered_signal = butter_lowpass_filter(shaped_signal, cutoff_freq, Fs)

# パワースペクトルの計算
def plot_power_spectrum(signal, fs, title):
    f, Pxx = welch(signal, fs, nperseg=1024)
    plt.plot(f, Pxx)
    plt.title(title)
    plt.xlabel('Frequency [Hz]')
    plt.ylabel('Power/Frequency [dB/Hz]')
    plt.grid(True)

# プロット
plt.figure(figsize=(14, 10))

plt.subplot(4, 1, 1)
plt.plot(t, x, label='Original Analog Signal')
plt.title('Original Analog Signal')
plt.xlabel('Time [s]')
plt.ylabel('Amplitude')
plt.grid(True)

plt.subplot(4, 1, 2)
plt.plot(t, dithered_signal, label='Signal with Dither', color='orange')
plt.title('Signal with Dither')
plt.xlabel('Time [s]')
plt.ylabel('Amplitude')
plt.grid(True)

plt.subplot(4, 1, 3)
plt.plot(t, quantized_signal, label='Quantized Signal', color='green')
plt.title('Quantized Signal')
plt.xlabel('Time [s]')
plt.ylabel('Amplitude')
plt.grid(True)

plt.subplot(4, 1, 4)
plt.plot(t, shaped_signal, label='Shaped Signal', color='red')
plt.title('Shaped Signal (Noise Shaping Applied)')
plt.xlabel('Time [s]')
plt.ylabel('Amplitude')
plt.grid(True)

plt.figure(figsize=(14, 6))

plt.subplot(3, 1, 1)
plot_power_spectrum(x, Fs, 'Power Spectrum of Original Analog Signal')

plt.subplot(3, 1, 2)
plot_power_spectrum(dithered_signal, Fs, 'Power Spectrum of Signal with Dither')

plt.subplot(3, 1, 3)
plot_power_spectrum(shaped_signal, Fs, 'Power Spectrum of Shaped Signal')

plt.tight_layout()
plt.show()
import numpy as np
import matplotlib.pyplot as plt
from scipy.signal import butter, filtfilt

# Parameters
Fs = 1000  # Sampling frequency (Hz)
T = 1  # Simulation time (seconds)
f_in = 5  # Input signal frequency (Hz)
A = 1  # Input signal amplitude
cutoff_freq = 20  # Low-pass filter cutoff frequency (Hz)

# Time array
t = np.arange(0, T, 1 / Fs)

# Sinusoidal input signal
u = A * np.sin(2 * np.pi * f_in * t)

# Initialize variables
y = np.zeros_like(u)  # Output
v = np.zeros_like(u)  # Difference
x = np.zeros_like(u)  # Integrator state
e = np.zeros_like(u)  # Quantization error

# Delta-Sigma Modulator Simulation (difference equations)
for n in range(1, len(u)):
    v[n] = u[n] - y[n - 1]  # Difference between input and previous output
    x[n] = v[n] + x[n - 1]  # Integrate the difference
    e[n] = x[n] - np.round(x[n])  # Quantization error (assuming round for quantization)
    y[n] = np.round(x[n])  # Output is quantized signal

# Low-pass filter design (Butterworth filter)
def butter_lowpass(cutoff, fs, order=5):
    nyq = 0.5 * fs  # Nyquist frequency
    normal_cutoff = cutoff / nyq  # Normalized cutoff frequency
    b, a = butter(order, normal_cutoff, btype='low', analog=False)
    return b, a

def lowpass_filter(data, cutoff, fs, order=5):
    b, a = butter_lowpass(cutoff, fs, order=order)
    y = filtfilt(b, a, data)
    return y

# Apply the low-pass filter to the quantized output
y_filtered = lowpass_filter(y, cutoff_freq, Fs)

# Plot the input, quantized output, and filtered output
plt.figure(figsize=(10, 8))

# Plot input signal
plt.subplot(3, 1, 1)
plt.plot(t, u, label='Input (sinusoidal)', color='blue')
plt.title('Delta-Sigma Modulator: Input, Output, and Filtered Output')
plt.xlabel('Time [s]')
plt.ylabel('Amplitude')
plt.grid(True)
plt.legend()

# Plot quantized output signal
plt.subplot(3, 1, 2)
plt.plot(t, y, label='Output (quantized)', color='red')
plt.xlabel('Time [s]')
plt.ylabel('Amplitude')
plt.grid(True)
plt.legend()

# Plot filtered output signal
plt.subplot(3, 1, 3)
plt.plot(t, y_filtered, label='Output (low-pass filtered)', color='green')
plt.xlabel('Time [s]')
plt.ylabel('Amplitude')
plt.grid(True)
plt.legend()

plt.tight_layout()
plt.show()
import numpy as np
import matplotlib.pyplot as plt
from scipy.signal import freqz

# High-Pass Filter (HPF) transfer function: H(z) = 1 - z^(-1)
def hpf_response(z_inverse):
    return 1 - z_inverse

# Low-Pass Filter (LPF) transfer function: H(z) = z^(-1) / (1 - z^(-1))
def lpf_response(z_inverse):
    return z_inverse / (1 - z_inverse)

# Sampling frequency and number of points
Fs = 1000  # Sampling frequency (Hz)
N = 512  # Number of frequency points

# Frequency array
w = np.linspace(0, np.pi, N)  # Frequency from 0 to pi (normalized frequency)
z_inverse = np.exp(-1j * w)  # z^(-1) in the z-domain

# Compute frequency response for HPF and LPF
hpf_h = hpf_response(z_inverse)
lpf_h = lpf_response(z_inverse)

# Plot the magnitude response
plt.figure(figsize=(10, 6))

# High-Pass Filter (HPF) magnitude response
plt.subplot(2, 1, 1)
plt.plot(w / np.pi, 20 * np.log10(np.abs(hpf_h)), label='HPF (1 - z^(-1))', color='blue')
plt.title('Frequency Response of HPF and LPF')
plt.xlabel('Normalized Frequency (xπ rad/sample)')
plt.ylabel('Magnitude (dB)')
plt.grid(True)
plt.legend()

# Low-Pass Filter (LPF) magnitude response
plt.subplot(2, 1, 2)
plt.plot(w / np.pi, 20 * np.log10(np.abs(lpf_h)), label='LPF (z^(-1) / (1 - z^(-1)))', color='red')
plt.xlabel('Normalized Frequency (xπ rad/sample)')
plt.ylabel('Magnitude (dB)')
plt.grid(True)
plt.legend()

plt.tight_layout()
plt.show()
import numpy as np
import matplotlib.pyplot as plt
from scipy.signal import welch

# Parameters
Fs = 1000  # Sampling frequency (Hz)
T = 1  # Simulation time (seconds)
N = int(Fs * T)  # Number of samples
fin = 50  # Input signal frequency (Hz)
A = 1  # Amplitude of input signal

# Time and frequency arrays
t = np.arange(0, T, 1/Fs)
frequencies = np.fft.fftfreq(N, 1/Fs)[:N // 2]

# Generate a sinusoidal input signal
input_signal = A * np.sin(2 * np.pi * fin * t)

# Quantization noise: random noise
quantization_noise = (np.random.rand(N) - 0.5) * 2 * 0.01  # Small random noise

# Spectrum of unshaped quantization noise
quantized_signal = input_signal + quantization_noise

# Noise shaping: apply a high-pass filter to the quantization noise
# Equivalent to (1 - z^-1), implemented in time domain
shaped_noise = quantization_noise - np.roll(quantization_noise, 1)

# Welch's method to estimate power spectral density
frequencies, psd_unshaped = welch(quantization_noise, Fs, nperseg=1024)
frequencies, psd_shaped = welch(shaped_noise, Fs, nperseg=1024)

# Plot the spectra
plt.figure(figsize=(12, 6))

# Spectrum of unshaped quantization noise
plt.subplot(1, 2, 1)
plt.semilogy(frequencies, psd_unshaped, color='red')
plt.title('Spectrum of Quantization Noise')
plt.xlabel('Fin/Fs [Hz]')
plt.ylabel('Power [dB]')
plt.grid(True)
plt.ylim([1e-12, 1e-3])

# Spectrum of shaped quantization noise
plt.subplot(1, 2, 2)
plt.semilogy(frequencies, psd_shaped, color='red')
plt.title('Spectrum of Noise-Shaped Quantization')
plt.xlabel('Fin/Fs [Hz]')
plt.ylabel('Power [dB]')
plt.grid(True)
plt.ylim([1e-12, 1e-3])

plt.tight_layout()
plt.show()
import numpy as np
import matplotlib.pyplot as plt
from scipy.signal import freqz

# Parameters
Fs = 1000  # Sampling frequency (Hz)
T = 1      # Simulation time (seconds)
N = int(Fs * T)  # Number of samples
f_in = 50  # Input signal frequency (Hz)
A = 1      # Input signal amplitude

# Time and frequency arrays
t = np.arange(0, T, 1 / Fs)
frequencies = np.linspace(0, np.pi, N // 2)  # Frequency range (0 to π rad/sample)

# Input signal (sinusoidal)
input_signal = A * np.sin(2 * np.pi * f_in * t)

# Quantization noise: small random noise
quantization_noise = (np.random.rand(N) - 0.5) * 0.01  # Small random noise

# STF(z) = 1, NTF(z) = 1 - z^(-1)
# Signal Transfer Function (STF): H(z) = 1
def signal_transfer_function():
    return np.ones_like(frequencies)

# Noise Transfer Function (NTF): H(z) = 1 - z^(-1)
def noise_transfer_function(z_inverse):
    return 1 - z_inverse

# Calculate z^(-1)
z_inverse = np.exp(-1j * frequencies)

# Compute STF and NTF
STF = signal_transfer_function()
NTF = noise_transfer_function(z_inverse)

# Apply the STF to the input signal (in frequency domain)
input_spectrum = np.fft.fft(input_signal)
output_spectrum_signal = STF * input_spectrum[:N // 2]

# Apply the NTF to the quantization noise (in frequency domain)
noise_spectrum = np.fft.fft(quantization_noise)
output_spectrum_noise = NTF * noise_spectrum[:N // 2]

# Compute power spectral density (magnitude squared of the spectrum)
psd_signal = np.abs(output_spectrum_signal)**2
psd_noise = np.abs(output_spectrum_noise)**2

# Plot the results
plt.figure(figsize=(10, 6))

# Plot signal power spectrum
plt.subplot(2, 1, 1)
plt.plot(frequencies / np.pi, 10 * np.log10(psd_signal), label='Signal Power Spectrum', color='blue')
plt.title('Signal and Noise Power Spectrum (1st-Order ΔΣ ADC)')
plt.xlabel('Normalized Frequency (xπ rad/sample)')
plt.ylabel('Power [dB]')
plt.grid(True)
plt.legend()

# Plot noise power spectrum (shaped by NTF)
plt.subplot(2, 1, 2)
plt.plot(frequencies / np.pi, 10 * np.log10(psd_noise), label='Noise Power Spectrum', color='red')
plt.xlabel('Normalized Frequency (xπ rad/sample)')
plt.ylabel('Power [dB]')
plt.grid(True)
plt.legend()

plt.tight_layout()
plt.show()
import numpy as np
import matplotlib.pyplot as plt
from scipy.signal import freqz

# Parameters
Fs = 1000  # Sampling frequency (Hz)
T = 1      # Simulation time (seconds)
N = int(Fs * T)  # Number of samples
f_in = 50  # Input signal frequency (Hz)
A = 1      # Input signal amplitude

# Time and frequency arrays
t = np.arange(0, T, 1 / Fs)
frequencies = np.linspace(0, np.pi, N // 2)  # Frequency range (0 to π rad/sample)

# Input signal (sinusoidal)
input_signal = A * np.sin(2 * np.pi * f_in * t)

# Quantization noise: small random noise
quantization_noise = (np.random.rand(N) - 0.5) * 0.01  # Small random noise

# STF(z) = z^2, NTF(z) = (1 - z^(-1))^2
# Signal Transfer Function (STF): H(z) = z^2
def signal_transfer_function(z_inverse):
    return z_inverse**2

# Noise Transfer Function (NTF): H(z) = (1 - z^(-1))^2
def noise_transfer_function(z_inverse):
    return (1 - z_inverse)**2

# Calculate z^(-1)
z_inverse = np.exp(-1j * frequencies)

# Compute STF and NTF
STF = signal_transfer_function(z_inverse)
NTF = noise_transfer_function(z_inverse)

# Apply the STF to the input signal (in frequency domain)
input_spectrum = np.fft.fft(input_signal)
output_spectrum_signal = STF * input_spectrum[:N // 2]

# Apply the NTF to the quantization noise (in frequency domain)
noise_spectrum = np.fft.fft(quantization_noise)
output_spectrum_noise = NTF * noise_spectrum[:N // 2]

# Compute power spectral density (magnitude squared of the spectrum)
psd_signal = np.abs(output_spectrum_signal)**2
psd_noise = np.abs(output_spectrum_noise)**2

# Plot the results
plt.figure(figsize=(10, 6))

# Plot signal power spectrum
plt.subplot(2, 1, 1)
plt.plot(frequencies / np.pi, 10 * np.log10(psd_signal), label='Signal Power Spectrum', color='blue')
plt.title('Signal and Noise Power Spectrum (2nd-Order ΔΣ ADC)')
plt.xlabel('Normalized Frequency (xπ rad/sample)')
plt.ylabel('Power [dB]')
plt.grid(True)
plt.legend()

# Plot noise power spectrum (shaped by NTF)
plt.subplot(2, 1, 2)
plt.plot(frequencies / np.pi, 10 * np.log10(psd_noise), label='Noise Power Spectrum', color='red')
plt.xlabel('Normalized Frequency (xπ rad/sample)')
plt.ylabel('Power [dB]')
plt.grid(True)
plt.legend()

plt.tight_layout()
plt.show()
import numpy as np
import matplotlib.pyplot as plt
from scipy.fft import fft, fftfreq

# Sampling parameters
fs = 10000  # Sampling frequency
T = 1.0 / fs  # Sampling period
N = 1024  # Number of samples
t = np.linspace(0.0, N*T, N, endpoint=False)

# Generate a sine wave input
f = 50  # Frequency of the sine wave
input_signal = np.sin(2.0 * np.pi * f * t)

# Define the Delta-Sigma modulator transfer function coefficients
a1, a2, b = 1, 1, 2  # Coefficients from the equation (STF and NTF conditions)

# Initialize variables for the modulator simulation
integrator1 = np.zeros(N)
integrator2 = np.zeros(N)
quantized_output = np.zeros(N)

# Perform the Delta-Sigma modulation
for i in range(1, N):
    integrator1[i] = integrator1[i-1] + input_signal[i] - quantized_output[i-1]
    integrator2[i] = integrator2[i-1] + integrator1[i] - quantized_output[i-1]
    quantized_output[i] = np.sign(integrator2[i])  # Simple quantization (1-bit)

# Plot the time-domain input and output
plt.figure(figsize=(12, 8))

plt.subplot(2, 1, 1)
plt.plot(t, input_signal, label="Input Signal (Sine Wave)")
plt.title("Input Signal (Sine Wave)")
plt.xlabel("Time [s]")
plt.ylabel("Amplitude")
plt.grid()

plt.subplot(2, 1, 2)
plt.plot(t, quantized_output, label="Quantized Output", color='orange')
plt.title("Quantized Output from Delta-Sigma Modulator")
plt.xlabel("Time [s]")
plt.ylabel("Amplitude")
plt.grid()

plt.tight_layout()
plt.show()

# FFT of the output signal
output_fft = fft(quantized_output)
frequencies = fftfreq(N, T)[:N//2]

# Plot the FFT result
plt.figure(figsize=(10, 6))
plt.plot(frequencies, 20 * np.log10(np.abs(output_fft[:N//2])), label="FFT of Quantized Output")
plt.title("FFT of Quantized Output")
plt.xlabel("Frequency [Hz]")
plt.ylabel("Magnitude [dB]")
plt.grid()
plt.show()
import numpy as np
import matplotlib.pyplot as plt
from scipy.signal import butter, lfilter, freqz
from scipy.fft import fft, fftfreq

# Sampling parameters
fs = 512000  # High oversampling frequency
T = 1.0 / fs  # Sampling period
N = 8192  # Number of samples for a good FFT resolution
t = np.linspace(0.0, N*T, N, endpoint=False)

# Generate a sine wave input at 50 Hz
f_input = 50  # Input sine wave frequency
input_signal = np.sin(2.0 * np.pi * f_input * t)

# Butterworth low-pass filter design (analog filter)
order = 5  # Filter order
cutoff = 200  # Cutoff frequency for the filter (Hz)

# Create a Butterworth low-pass filter
b, a = butter(order, cutoff / (0.5 * fs), btype='low', analog=False)
filtered_signal = lfilter(b, a, input_signal)

# Define the Delta-Sigma modulator
integrator = np.zeros(N)
quantized_output = np.zeros(N)

# Delta-Sigma modulation loop
for i in range(1, N):
    integrator[i] = integrator[i-1] + filtered_signal[i] - quantized_output[i-1]
    quantized_output[i] = np.sign(integrator[i])  # 1-bit quantizer

# Decimation by 64 (simulating oversampling and downsampling)
decimation_factor = 64
decimated_output = quantized_output[::decimation_factor]

# Time-domain plots (Input, Filtered, and Quantized)
plt.figure(figsize=(14, 8))

plt.subplot(3, 1, 1)
plt.plot(t, input_signal, label="Input Sine Wave")
plt.title("Input Sine Wave")
plt.xlabel("Time [s]")
plt.grid()

plt.subplot(3, 1, 2)
plt.plot(t, filtered_signal, label="Filtered Signal (Low-pass)", color='green')
plt.title("Filtered Signal (After Butterworth Filter)")
plt.xlabel("Time [s]")
plt.grid()

plt.subplot(3, 1, 3)
plt.plot(t, quantized_output, label="Quantized Output (1-bit)", color='orange')
plt.title("Quantized Output from Delta-Sigma Modulator")
plt.xlabel("Time [s]")
plt.grid()

plt.tight_layout()
plt.show()

# FFT of the decimated output signal
decimated_N = len(decimated_output)
decimated_T = T * decimation_factor
frequencies = fftfreq(decimated_N, decimated_T)[:decimated_N//2]
fft_output = fft(decimated_output)

# Plot FFT of the decimated signal
plt.figure(figsize=(10, 6))
plt.plot(frequencies, 20 * np.log10(np.abs(fft_output[:decimated_N//2])), label="FFT of Decimated Output")
plt.title("FFT of Decimated Output")
plt.xlabel("Frequency [Hz]")
plt.ylabel("Magnitude [dB]")
plt.grid()
plt.show()
import numpy as np
import matplotlib.pyplot as plt
from scipy.fftpack import fft

# Parameters for sine wave generation
amplitude = 1
frequency = 1000  # Hz
sampling_rate = 100000  # samples per second
duration = 0.01  # duration of signal in seconds
num_samples = int(sampling_rate * duration)

# Generate a time vector
t = np.linspace(0, duration, num_samples, endpoint=False)

# Generate sine wave input
input_signal = amplitude * np.sin(2 * np.pi * frequency * t)

# 1-bit Delta-Sigma Modulator
def delta_sigma_modulate(input_signal):
    output_signal = np.zeros_like(input_signal)
    sigma = 0  # Integrator value
    for i, sample in enumerate(input_signal):
        sigma += sample
        if sigma > 0:
            output_signal[i] = 1
            sigma -= 1
        else:
            output_signal[i] = -1
            sigma += 1
    return output_signal

# Perform modulation
modulated_signal = delta_sigma_modulate(input_signal)

# FFT of input and modulated signals
def plot_fft(signal, sampling_rate, title):
    N = len(signal)
    fft_result = fft(signal)
    fft_magnitude = 2.0/N * np.abs(fft_result[:N//2])
    freqs = np.fft.fftfreq(N, 1/sampling_rate)[:N//2]

    plt.figure(figsize=(10, 6))
    plt.plot(freqs, fft_magnitude)
    plt.title(title)
    plt.xlabel("Frequency (Hz)")
    plt.ylabel("Amplitude")
    plt.grid()
    plt.show()

# Plot time-domain signals
plt.figure(figsize=(10, 6))
plt.plot(t[:1000], input_signal[:1000], label="Input Sine Wave")
plt.plot(t[:1000], modulated_signal[:1000], label="Delta-Sigma Modulated (1-bit)")
plt.title("Input and 1-bit Modulated Signal (Time Domain)")
plt.xlabel("Time [s]")
plt.ylabel("Amplitude")
plt.legend()
plt.grid()
plt.show()

# Plot FFTs
plot_fft(input_signal, sampling_rate, "FFT of Input Sine Wave")
plot_fft(modulated_signal, sampling_rate, "FFT of 1-bit Delta-Sigma Modulated Signal")
import numpy as np
import matplotlib.pyplot as plt
from scipy.fftpack import fft

# Parameters for sine wave generation
amplitude = 1
frequency = 1000  # Hz
sampling_rate = 100000  # samples per second
duration = 0.01  # duration of signal in seconds
num_samples = int(sampling_rate * duration)

# Generate time vector
t = np.linspace(0, duration, num_samples, endpoint=False)

# Generate sine wave input
input_signal = amplitude * np.sin(2 * np.pi * frequency * t)

# Second-Order Delta-Sigma Modulator
def second_order_delta_sigma_modulate(input_signal):
    sigma1 = 0  # First integrator value
    sigma2 = 0  # Second integrator value
    output_signal = np.zeros_like(input_signal)
    delta1 = 0  # Delta for first integrator
    delta2 = 0  # Delta for second integrator

    for i, sample in enumerate(input_signal):
        # First stage of Delta-Sigma modulation (First integrator)
        sigma1 += sample - delta1
        # Second stage of Delta-Sigma modulation (Second integrator)
        sigma2 += sigma1 - delta2
        # Quantize the signal
        if sigma2 > 0:
            output_signal[i] = 1
            delta2 = 1  # Output 1 corresponds to +Vref
        else:
            output_signal[i] = -1
            delta2 = -1  # Output -1 corresponds to -Vref
        delta1 = output_signal[i]  # Feedback from quantizer output

    return output_signal

# Perform modulation
modulated_signal = second_order_delta_sigma_modulate(input_signal)

# FFT of input and modulated signals
def plot_fft(signal, sampling_rate, title):
    N = len(signal)
    fft_result = fft(signal)
    fft_magnitude = 2.0/N * np.abs(fft_result[:N//2])
    freqs = np.fft.fftfreq(N, 1/sampling_rate)[:N//2]

    plt.figure(figsize=(10, 6))
    plt.plot(freqs, fft_magnitude)
    plt.title(title)
    plt.xlabel("Frequency (Hz)")
    plt.ylabel("Amplitude")
    plt.grid()
    plt.show()

# Plot time-domain signals
plt.figure(figsize=(10, 6))
plt.plot(t[:1000], input_signal[:1000], label="Input Sine Wave")
plt.plot(t[:1000], modulated_signal[:1000], label="Second-Order ΔΣ Modulated Signal", linestyle="--")
plt.title("Input and 2nd Order Delta-Sigma Modulated Signal (Time Domain)")
plt.xlabel("Time [s]")
plt.ylabel("Amplitude")
plt.legend()
plt.grid()
plt.show()

# Plot FFTs
plot_fft(input_signal, sampling_rate, "FFT of Input Sine Wave")
plot_fft(modulated_signal, sampling_rate, "FFT of Second-Order Delta-Sigma Modulated Signal")
import numpy as np
import matplotlib.pyplot as plt

# Parameters
amplitude = 1  # Amplitude of the input signal
frequency = 10  # Frequency of the input signal in Hz
sampling_rate = 100  # Samples per second
duration = 1  # Duration in seconds
num_samples = int(sampling_rate * duration)

# 5-bit quantizer parameters
quantization_levels = 2**5  # 5-bit quantizer has 32 levels
quantizer_step = 1 / quantization_levels  # Step size for each quantization level

# Generate time vector
t = np.linspace(0, duration, num_samples, endpoint=False)

# Generate sine wave input
input_signal = amplitude * np.sin(2 * np.pi * frequency * t)

# First-Order Delta-Sigma Modulator with 5-bit Quantizer
def first_order_delta_sigma_modulate_5bit(input_signal):
    output_signal = np.zeros_like(input_signal)
    y_n = 0  # Initial state for integrator
    v_n = 0  # Initial state for quantizer feedback
    quantization_error = np.zeros_like(input_signal)

    for i, u_n in enumerate(input_signal):
        # Calculate the difference between input and feedback
        u_minus_v = u_n - v_n

        # Integrator stage (accumulator)
        y_n = u_minus_v + y_n  # y(n) = u(n) - v(n-1) + y(n-1)

        # 5-bit Quantizer stage
        quantized_value = np.round(y_n / quantizer_step) * quantizer_step
        v_n = quantized_value  # Update quantizer feedback

        # Store output and quantization error
        output_signal[i] = quantized_value
        quantization_error[i] = u_n - quantized_value  # Error = input - quantized value

    return output_signal, quantization_error

# Perform modulation
modulated_signal, quantization_error = first_order_delta_sigma_modulate_5bit(input_signal)

# Plot the input signal and the modulated output signal
plt.figure(figsize=(10, 6))
plt.plot(t, input_signal, label="Input Sine Wave")
plt.plot(t, modulated_signal, label="5-bit Quantized Output Signal", linestyle='--')
plt.title("Input Sine Wave and 5-bit Quantized Output Signal (Time Domain)")
plt.xlabel("Time [s]")
plt.ylabel("Amplitude")
plt.legend()
plt.grid()
plt.show()

# Plot the quantization error
plt.figure(figsize=(10, 6))
plt.plot(t, quantization_error, label="Quantization Error")
plt.title("Quantization Error of First-Order Delta-Sigma Modulator")
plt.xlabel("Time [s]")
plt.ylabel("Error Amplitude")
plt.legend()
plt.grid()
plt.show()
import numpy as np
import matplotlib.pyplot as plt
from scipy.signal import butter, lfilter, freqz

# 1. Generate the input sine wave signal
fs = 1000  # Sampling frequency (Hz)
f = 10     # Frequency of the sine wave (Hz)
t = np.linspace(0, 1, fs, endpoint=False)  # Time vector
input_signal = np.sin(2 * np.pi * f * t)  # Input sine wave signal

# 2. Delta-Sigma modulation
class DeltaSigmaModulator:
    def __init__(self):
        self.integrator = 0
        self.previous_output = 0

    def modulate(self, input_signal):
        pdm_output = []
        for sample in input_signal:
            self.integrator += sample - self.previous_output
            modulated_signal = 1 if self.integrator >= 0 else 0
            pdm_output.append(modulated_signal)
            self.previous_output = modulated_signal
        return np.array(pdm_output)

modulator = DeltaSigmaModulator()
pdm_signal = modulator.modulate(input_signal)

# 3. Calculate frequency spectrum of the PDM signal
pdm_freq_spectrum = np.fft.fft(pdm_signal)
pdm_freq_spectrum = np.abs(pdm_freq_spectrum[:fs//2])  # Use half of the spectrum
frequencies = np.fft.fftfreq(fs, 1/fs)[:fs//2]  # Frequency range

# 4. Low-pass filter design
def butter_lowpass(cutoff, fs, order=5):
    nyq = 0.5 * fs  # Nyquist Frequency
    normal_cutoff = cutoff / nyq
    b, a = butter(order, normal_cutoff, btype='low', analog=False)
    return b, a

def butter_lowpass_filter(data, cutoff, fs, order=5):
    b, a = butter_lowpass(cutoff, fs, order=order)
    y = lfilter(b, a, data)
    return y

# Apply low-pass filter to PDM signal
cutoff = 20  # Cutoff frequency of the low-pass filter (Hz)
filtered_signal = butter_lowpass_filter(pdm_signal, cutoff, fs, order=5)

# 5. Plotting
plt.figure(figsize=(12, 10))

# Plot original input sine wave
plt.subplot(3, 1, 1)
plt.plot(t, input_signal, label='Input Signal (Sine Wave)')
plt.title('Original Input Signal')
plt.xlabel('Time [s]')
plt.ylabel('Amplitude')
plt.grid()
plt.legend()

# Plot PDM Signal
plt.subplot(3, 1, 2)
plt.step(t, pdm_signal, label='PDM Signal', color='r')
plt.title('PDM Signal after Delta-Sigma Modulation')
plt.xlabel('Time [s]')
plt.ylabel('Amplitude')
plt.grid()
plt.legend()

# Plot frequency spectrum of PDM signal
plt.subplot(3, 1, 3)
plt.plot(frequencies, pdm_freq_spectrum, label='PDM Frequency Spectrum')
plt.title('Frequency Spectrum of PDM Signal')
plt.xlabel('Frequency [Hz]')
plt.ylabel('Magnitude')
plt.grid()
plt.legend()

plt.tight_layout()
plt.show()

# Plot filtered signal to demonstrate reconstruction
plt.figure(figsize=(12, 5))
plt.plot(t, filtered_signal, label='Reconstructed Signal after Low-Pass Filter')
plt.title('Reconstructed Analog Signal from PDM using Low-Pass Filter')
plt.xlabel('Time [s]')
plt.ylabel('Amplitude')
plt.grid()
plt.legend()
plt.show()
import numpy as np
import matplotlib.pyplot as plt

# 1. デルタシグマ変調器のクラスを定義
class DeltaSigmaModulator:
    def __init__(self):
        self.integrator = 0  # 積分器の初期値
        self.previous_output = 0  # 直前の出力値

    def modulate(self, input_signal):
        """
        デルタシグマ変調を行い、入力デジタル信号をPDM信号に変換する。
        input_signal: デジタル入力信号の配列
        return: 変調されたPDM信号の配列
        """
        pdm_output = []  # PDM信号の出力配列

        for x in input_signal:
            # 1. デルタ計算: 入力信号と出力信号の差分を計算
            delta = x - self.previous_output
            # 2. シグマ計算: 積分器の値を更新 (入力と出力の差を蓄積)
            self.integrator += delta
            # 3. 量子化 (2値化)
            if self.integrator >= 0:
                y = 1  # 出力を1に設定
            else:
                y = 0  # 出力を0に設定
            # 4. 出力信号を保存
            pdm_output.append(y)
            # 5. 直前の出力値を更新
            self.previous_output = y

        return pdm_output

# 2. デジタル入力信号の生成 (例として正弦波)
fs = 1000  # サンプリング周波数 (Hz)
f = 5      # 入力信号の周波数 (Hz)
t = np.linspace(0, 1, fs, endpoint=False)  # 時間軸
input_signal = 0.5 * (np.sin(2 * np.pi * f * t) + 1)  # 正規化されたデジタル信号 [0, 1]

# 3. デルタシグマ変調器のインスタンスを作成し、変調を実行
modulator = DeltaSigmaModulator()
pdm_signal = modulator.modulate(input_signal)

# 4. 信号のプロット
plt.figure(figsize=(12, 8))

# 元のデジタル入力信号をプロット
plt.subplot(3, 1, 1)
plt.plot(t, input_signal, label='Input Signal (Sine Wave)', color='b')
plt.title('Original Digital Input Signal')
plt.xlabel('Time [s]')
plt.ylabel('Amplitude')
plt.grid(True)
plt.legend()

# 変調されたPDM信号をプロット
plt.subplot(3, 1, 2)
plt.step(t, pdm_signal, label='PDM Signal', color='r')
plt.title('PDM Signal after Delta-Sigma Modulation')
plt.xlabel('Time [s]')
plt.ylabel('Amplitude')
plt.grid(True)
plt.legend()

# 積分器の出力(シグマ演算)のプロット
plt.subplot(3, 1, 3)
integrator_output = np.cumsum([x - y for x, y in zip(input_signal, pdm_signal)])
plt.plot(t, integrator_output, label='Integrator Output (Σ)', color='g')
plt.title('Integrator Output during Delta-Sigma Modulation')
plt.xlabel('Time [s]')
plt.ylabel('Integrator Value')
plt.grid(True)
plt.legend()

plt.tight_layout()
plt.show()
import numpy as np
import matplotlib.pyplot as plt

# 1. 入力サイン波の生成
fs = 1000  # サンプリング周波数 (Hz)
f = 5      # サイン波の周波数 (Hz)
t = np.linspace(0, 1, fs, endpoint=False)  # 時間軸 (1秒間)
input_signal = 0.8 * np.sin(2 * np.pi * f * t)  # 正規化されたサイン波 (振幅: 0.8)

# 2. デルタシグマ変調器のクラス定義
class DeltaSigmaModulator:
    def __init__(self):
        self.integrator = 0  # 積分器の初期値
        self.previous_error = 0  # 前回の量子化誤差 e[n-1]

    def modulate(self, input_signal):
        """
        デルタシグマ変調を行い、入力デジタル信号をPDM信号に変換する。
        input_signal: デジタル入力信号の配列
        return: 変調されたPDM信号の配列
        """
        pdm_output = []  # PDM信号の出力配列
        for x in input_signal:
            # 量子化誤差を計算 e[n] = x[n] - y[n-1]
            error = x - self.previous_error
            # 積分器の更新
            self.integrator += error
            # 出力の量子化(積分器の値が正なら1、負なら0)
            if self.integrator >= 0:
                y = 1
            else:
                y = -1  # 量子化出力は -1 または 1 とする

            # 出力信号を保存
            pdm_output.append(y)
            # 現在の量子化出力を次のステップの量子化誤差に設定
            self.previous_error = y

        return pdm_output

# 3. デルタシグマ変調器のインスタンスを作成し、変調を実行
modulator = DeltaSigmaModulator()
pdm_signal = modulator.modulate(input_signal)

# 4. プロットの設定
plt.figure(figsize=(12, 8))

# 入力サイン波をプロット
plt.subplot(3, 1, 1)
plt.plot(t, input_signal, label='Input Signal (Sine Wave)', color='b')
plt.title('Original Input Signal (Sine Wave)')
plt.xlabel('Time [s]')
plt.ylabel('Amplitude')
plt.grid(True)
plt.legend()

# 変調されたPDM信号をプロット
plt.subplot(3, 1, 2)
plt.step(t, pdm_signal, label='PDM Signal', color='r', where='post')
plt.title('PDM Signal after Delta-Sigma Modulation')
plt.xlabel('Time [s]')
plt.ylabel('Amplitude')
plt.grid(True)
plt.legend()

# 積分器の出力 y(n) のプロット
integrator_output = np.cumsum([x - y for x, y in zip(input_signal, pdm_signal)])
plt.subplot(3, 1, 3)
plt.plot(t, integrator_output, label='Integrator Output (Σ)', color='g')
plt.title('Integrator Output during Delta-Sigma Modulation')
plt.xlabel('Time [s]')
plt.ylabel('Integrator Value')
plt.grid(True)
plt.legend()

plt.tight_layout()
plt.show()
import numpy as np
import matplotlib.pyplot as plt
from scipy.signal import freqz, lfilter

# パラメータ設定
Fs = 64 * 1e3  # サンプリング周波数 (64kHz)
Fin = 1e3      # 入力信号の周波数 (1kHz)
N = 1024       # サンプル数
t = np.arange(N) / Fs  # 時間ベクトル

# 入力信号(サイン波)の生成
input_signal = 0.5 * np.sin(2 * np.pi * Fin * t)

# 1次シグマ・デルタ変調器のシミュレーション
# 量子化誤差と前の積分値の初期化
quantization_error = 0
integrator = 0

# 変調結果の格納用配列
delta_modulated_signal = np.zeros(N)

# シグマ・デルタ変調の実行
for i in range(N):
    integrator += input_signal[i] - quantization_error
    quantization_error = np.sign(integrator)
    delta_modulated_signal[i] = quantization_error

# 周波数特性の計算
freq_response, h = freqz(delta_modulated_signal, worN=N, fs=Fs)

# 結果のプロット
plt.figure(figsize=(14, 6))

# 入力信号と変調信号のプロット
plt.subplot(2, 1, 1)
plt.plot(t, input_signal, label='Input Signal (1 kHz)')
plt.plot(t, delta_modulated_signal, label='Delta Modulated Signal')
plt.xlabel('Time (s)')
plt.ylabel('Amplitude')
plt.title('Input Signal vs Delta Modulated Signal')
plt.legend()
plt.grid()

# ノイズシェーピングの効果を示すパワースペクトル密度
plt.subplot(2, 1, 2)
plt.plot(freq_response, 20 * np.log10(np.abs(h)), label='Noise Shaped Spectrum')
plt.xlabel('Frequency (Hz)')
plt.ylabel('Magnitude (dB)')
plt.title('Noise Shaped Spectrum of Delta Modulated Signal')
plt.legend()
plt.grid()

plt.tight_layout()
plt.show()