入力電圧と出力電圧の関係について(Pipeline 1.5ビットADCのビット出力)
1. はじめに
本記事では、入力電圧に対する出力電圧およびビット出力の関係について解説します。特に、Pipeline ADC(逐次比較型ADCとは異なる並列処理方式のAD変換器) におけるビット出力の仕組みを理解するためのシミュレーションを紹介します。
本稿の内容は、以下の参考文献を基にしています:
Pipeline ADCの解説記事
2. シミュレーションの概要
本シミュレーションでは、
- 入力信号として ランプ波(時間とともに直線的に増加する信号)を使用
- しきい値電圧(Threshold Voltage)を2つ設定し、それを超えるごとにビットを変化
- 出力電圧とビット出力の関係をプロット
これにより、入力電圧の変化に伴うADCのビット出力の変化を視覚的に確認できます。
3. シミュレーションのPythonコード
import numpy as np
import matplotlib.pyplot as plt

# しきい値電圧の設定
V_th1 = 2.0  # しきい値電圧1
V_th2 = 4.0  # しきい値電圧2
V_max = 6.0  # 入力の最大値
VDD = 5.0    # 出力電圧の最大値

# 時間軸の設定
t = np.linspace(0, 1, 500)  # 0から1秒の範囲
V_in = V_max * t  # ランプ波 (直線的に増加する信号)
V_out = np.zeros_like(V_in)
bit_out = np.zeros_like(V_in)

# 出力電圧とビットの計算
for i, Vin in enumerate(V_in):
    if Vin < V_th1:
        V_out[i] = (VDD / V_th1) * Vin
        bit_out[i] = 0
    elif V_th1 <= Vin < V_th2:
        V_out[i] = (VDD / (V_th2 - V_th1)) * (Vin - V_th1)
        bit_out[i] = 1
    else:
        V_out[i] = (VDD / (V_max - V_th2)) * (Vin - V_th2)
        bit_out[i] = 2

# 入力電圧と出力電圧のプロット
plt.figure(figsize=(8, 5))
plt.plot(t, V_in, label='Input Voltage (Ramp Wave)', linestyle='--')
plt.plot(t, V_out, label='Output Voltage')
plt.axhline(V_th1, color='r', linestyle='--', label='Threshold 1')
plt.axhline(V_th2, color='g', linestyle='--', label='Threshold 2')
plt.xlabel("Time (s)")
plt.ylabel("Voltage (V)")
plt.title("Input-Output Relationship with Ramp Wave")
plt.legend()
plt.grid()
plt.show()

# ビット出力のプロット
plt.figure(figsize=(8, 5))
plt.step(t, bit_out, label='Bit Output', linestyle='-', where='post')
plt.xlabel("Time (s)")
plt.ylabel("Bit Value")
plt.title("Bit Output over Time")
plt.legend()
plt.grid()
plt.show()
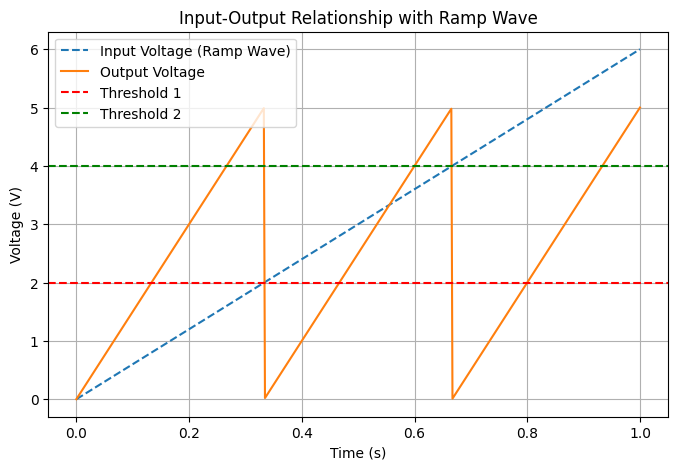
4. 実験結果の解釈
(1) 入力電圧 vs 出力電圧
- 0V 〜 2V:直線的に増加(ビット0)
- 2V 〜 4V:再度直線的に増加(ビット1)
- 4V 〜 6V:さらに直線的に増加(ビット2)
(2) ビット出力
- 入力電圧 < 2V ではビット出力は 0
- 2V ≤ 入力電圧 < 4V ではビット出力は 1
- 4V ≤ 入力電圧 ではビット出力は 2

5. まとめ
本記事では、Pipeline ADC のしきい値電圧に基づくビット出力の変化 をシミュレーションしました。ランプ波入力に対するADCの動作を理解するための基本的なシミュレーションとして、特にしきい値電圧を超えた際の変化を観察するのに適しています。
詳細な Pipeline ADC の理論や動作については、Pipeline ADCの解説記事 を参照してください。
def process_input(Vin, VREF=30):
    """
    Process the input voltage Vin and determine the output code and Vout.

    Parameters:
        Vin (float): Input voltage
        VREF (float): Reference voltage (default: 10V)

    Returns:
        tuple: (code, Vout) where
               code (str): 2-bit binary code ('00', '01', '10')
               Vout (float): Processed output voltage
    """
    threshold = VREF / 4  # Calculate threshold values

    if Vin < -threshold:
        code = "00"
        Vout = 2 * Vin + VREF
    elif -threshold <= Vin <= threshold:
        code = "01"
        Vout = 2 * Vin
    else:  # Vin > threshold
        code = "10"
        Vout = 2 * Vin - VREF

    return code, Vout


# 初期値設定
A = 3  # 初期入力値
N = 30  # ステップ数
Vin = A

print("Step | Vin  | Code | Vout")
print("----------------------------")

# Nステップ分の計算
for step in range(1, N + 1):
    code, Vout = process_input(Vin, VREF=10)
    print(f"  {step}  | {Vin:.2f} |  {code}  | {Vout:.2f}")
    Vin = Vout  # 次のステップの入力を更新
import numpy as np

def process_input(Vin, VREF=10):
    """
    Process the input voltage Vin and determine D1, D2, and Vout.

    Parameters:
        Vin (float): Input voltage
        VREF (float): Reference voltage (default: 10V)

    Returns:
        tuple: (D1, D2, Vout) where
               D1 (int): First decision bit (0 or 1)
               D2 (int): Second decision bit (0 or 1)
               Vout (float): Processed output voltage
    """
    threshold1 = (3/8) * VREF  # しきい値1
    threshold2 = (5/8) * VREF  # しきい値2

    if Vin < threshold1:
        D1, D2 = 0, 0
        Vout = 2 * Vin
    elif threshold1 <= Vin < threshold2:
        D1, D2 = 0, 1
        Vout = 2 * Vin - VREF / 2
    else:  # Vin >= threshold2
        D1, D2 = 1, 0
        Vout = 2 * Vin - VREF

    return D1, D2, Vout


# 初期設定
A = 0      # ランプ波の開始値
N = 20     # ステップ数
VREF = 10  # 参照電圧
delta_V = VREF / (N-1)  # ランプ波の増加量

print("Step | Vin  | D1 | D2 | Vout")
print("--------------------------------")

Vin_values = []  # Vin の値を保存
Vout_values = [] # Vout の値を保存

# ランプ波を使ったNステップ分の計算
for step in range(1, N + 1):
    Vin = A + (step - 1) * delta_V  # ランプ波 (直線増加)
    D1, D2, Vout = process_input(Vin, VREF)

    Vin_values.append(Vin)   # Vin を保存
    Vout_values.append(Vout) # Vout を保存

    print(f"  {step:2}  | {Vin:.2f} |  {D1}  |  {D2}  | {Vout:.2f}")

# ランプ波とVoutの変化を可視化
import matplotlib.pyplot as plt

plt.figure(figsize=(8, 5))

# Vin (ランプ波)
plt.plot(Vin_values, label="Vin (Ramp Wave)", marker="o", linestyle="-")

# Vout
plt.plot(Vout_values, label="Vout", marker="s", linestyle="--")

# グラフの設定
plt.axhline(y=(3/8)*VREF, color="gray", linestyle=":", label="Threshold 1")
plt.axhline(y=(5/8)*VREF, color="gray", linestyle="--", label="Threshold 2")

plt.xlabel("Step")
plt.ylabel("Voltage (V)")
plt.title("Ramp Wave Input and Output Voltage")
plt.legend()
plt.grid(True)
plt.show()