回帰直線とは
組となるデータの、中心的な分布傾向を表す直線。
最小二乗法( least squares method )によって求められます。
最小二乗法の式
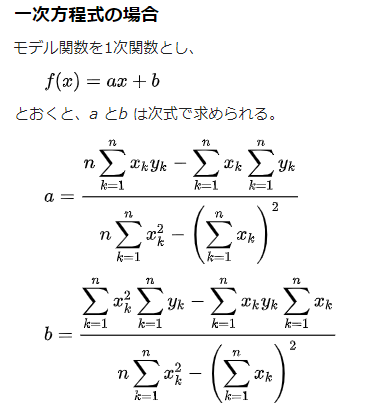
📖最小二乗法(wikipedia)より引用
これを、javascript( ES6 )で関数化します。
Σをreduceで表現しています。
// 回帰直線を求める(最小二乗法)
const lsm = coordinates => {
  const n = coordinates.length;
  const sigX = coordinates.reduce((acc, c) => acc + c.x, 0);
  const sigY = coordinates.reduce((acc, c) => acc + c.y, 0);
  const sigXX = coordinates.reduce((acc, c) => acc + c.x * c.x, 0);
  const sigXY = coordinates.reduce((acc, c) => acc + c.x * c.y, 0);
  // a(傾き)を求める
  const a = (n * sigXY - sigX * sigY) / (n * sigXX - Math.pow(sigX, 2));
  // b(切片)を求める
  const b = (sigXX * sigY - sigXY * sigX) / (n * sigXX - Math.pow(sigX, 2));
  return { a, b };
}
👀動作確認
ドライバを作成して呼び出してみます。
  const coordinates = [
    { x: 200, y: 100 },
    { x: 250, y: 150 },
    { x: 300, y: 150 },
    { x: 312, y: 200 },
    { x: 330, y: 210 },
    { x: 100, y: 80 },
    { x: 110, y: 40 },
  ]

  const { a, b } = lsm(coordinates)
  console.log(a, b)
結果
0.6227602344112315 -9.665985075256124
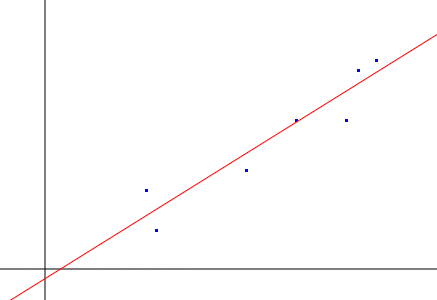
📈グラフを書いて確認
canvasにグラフを描画して確認してみました。
青のドットがサンプルデータ、赤が回帰直線です。
確認に使ったソースコードは以下です。
html
<html>
  <head></head>
  <body>
    <canvas id="graph" width="500" height="500"></canvas>
    <script type="text/javascript" src="main.js"></script>
  </body>
</html>
javascript
main.js
// 回帰直線を求める(最小二乗法)
const lsm = coordinates => {
  const n = coordinates.length
  const sigX = coordinates.reduce((acc, c) => acc + c.x, 0)
  const sigY = coordinates.reduce((acc, c) => acc + c.y, 0)
  const sigXX = coordinates.reduce((acc, c) => acc + c.x * c.x, 0)
  const sigXY = coordinates.reduce((acc, c) => acc + c.x * c.y, 0)
  // a(傾き)を求める
  const a = (n * sigXY - sigX * sigY) / (n * sigXX - Math.pow(sigX, 2));
  // b(切片)を求める
  const b = (sigXX * sigY - sigXY * sigX) / (n * sigXX - Math.pow(sigX, 2));
  return { a, b }
}

const canvas = document.getElementById('graph');
if (canvas.getContext) {
  const ctx = canvas.getContext('2d');

  // x軸の描画
  ctx.beginPath();
  ctx.moveTo(100, 0);
  ctx.lineTo(100, 500);
  ctx.stroke();
  // y軸の描画
  ctx.beginPath();
  ctx.moveTo(0, 400);
  ctx.lineTo(500, 400);
  ctx.stroke();

  const coordinates = [
    { x: 200, y: 100 },
    { x: 250, y: 150 },
    { x: 300, y: 150 },
    { x: 312, y: 200 },
    { x: 330, y: 210 },
    { x: 100, y: 80 },
    { x: 110, y: 40 },
  ]
  // サンプルデータの点を描画
  ctx.fillStyle = "rgb(0, 0, 255)"
  coordinates.forEach(c => {
    ctx.fillRect(c.x + 100, -c.y + 400, 3, 3)
  })

  // 回帰直線の描画
  const { a, b } = lsm(coordinates)
  ctx.strokeStyle = "rgb(255, 0, 0)";
  ctx.beginPath();
  ctx.moveTo(-100 + 100, -(-100 * a + b) + 400);
  ctx.lineTo(400 + 100, -(400 * a + b) + 400);
  ctx.stroke();
}
コードのダウンロードはここ。
以上。