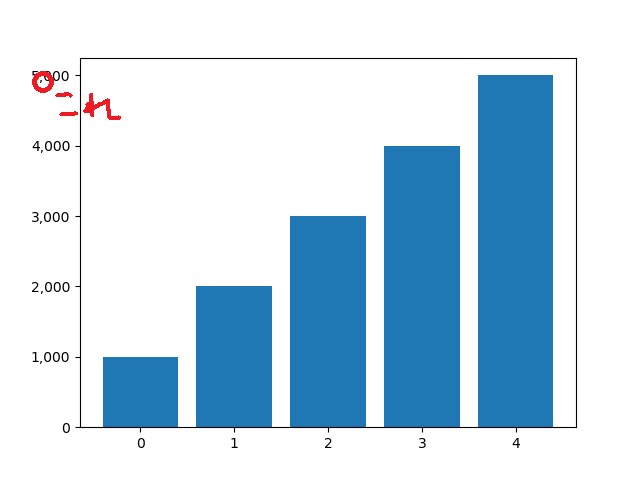
matplotlibでグラフを描画する際、
y軸の数値を__三桁毎にカンマで区切って表示したい__場合があります。
検索してもすぐに見つからなかったので、備忘も含めて下記に記載。
import numpy as np
import matplotlib.pyplot as plt

height = np.array([1000, 2000, 3000, 4000, 5000])


fig, ax = plt.subplots(1, 1)
# 三桁カンマの設定
ax.yaxis.set_major_formatter(plt.FuncFormatter(lambda x, loc: "{:,}".format(int(x))))

plt.bar(range(len(height)), height)
plt.show()
x軸を三桁区切りにする場合は、yaxis→xaxisでOK