多項式回帰とは
与えられた各点を通るような直線を単回帰では1次式(直線)で近似するが、多項式回帰では2次以上の曲線で近似する。
n次の近似多項式を以下のようにおく。
$y = \beta_0 + \beta_1 x + \cdots + \beta_n x^n$
点 $(x_1, y_1), (x_2, y_2), \cdots, (x_m, y_m)$ に対して、誤差 $\varepsilon_i$ を考慮し
$y_{i}=\beta_{0}+\beta_{1}x_{i}+\beta_{2}x_{i}^{2}+\cdots +\beta_{n}x_{i}^{n}+\varepsilon_{i}\ (i=1,2,\dots ,m)$
とする。
誤差ベクトル
\varepsilon =
\begin{pmatrix}
\varepsilon_{1}\\
\varepsilon_{2}\\
\varepsilon_{3}\\
\vdots \\
\varepsilon_{m}
\end{pmatrix}
の大きさが最小となる $(\beta_0,\ \cdots,\ \beta_n)$ を求めたい。これは以下の事実がある。
y=\begin{pmatrix}
y_{1} \\
y_{2} \\
y_{3} \\
\vdots \\
y_{m}
\end{pmatrix},
X = \begin{pmatrix}
1&x_{1}&x_{1}^{2}&\dots &x_{1}^{n}\\
1&x_{2}&x_{2}^{2}&\dots &x_{2}^{n}\\
1&x_{3}&x_{3}^{2}&\dots &x_{3}^{n}\\
\vdots &\vdots &\vdots &\ddots &\vdots \\
1&x_{m}&x_{m}^{2}&\dots &x_{m}^{n}
\end{pmatrix},
\beta = \begin{pmatrix}
\beta_{0}\\
\beta_{1}\\
\beta_{2}\\
\vdots \\
\beta _{n}
\end{pmatrix},
\varepsilon =
\begin{pmatrix}
\varepsilon_{1}\\
\varepsilon_{2}\\
\varepsilon_{3}\\
\vdots \\
\varepsilon_{m}
\end{pmatrix}
$y=X\beta + \varepsilon$ の $\varepsilon$ が最小となる $\beta$ は、$\beta = (X^TX)^{-1}X^Ty$ である。
実装
こちらに置きました。
import numpy as np
import matplotlib.pyplot as plt
plt.figure(figsize=(12, 10))
def pol_reg(x_input, y_input, deg):
l = []
for x in x_input:
tmp = []
for j in range(0, deg + 1):
tmp.append(x ** j)
l.append(tmp)
X = np.array(l, dtype=float)
vector = np.array([[y] for y in y_input])
coef = ((np.linalg.inv(X.T @ X)) @ X.T) @ vector
x_axis = np.linspace(x_input[0], x_input[-1], 100)
y_axis = []
for z in x_axis:
val = 0
for i in range(len(coef)):
val += coef[i][0] * z ** i
y_axis.append(val)
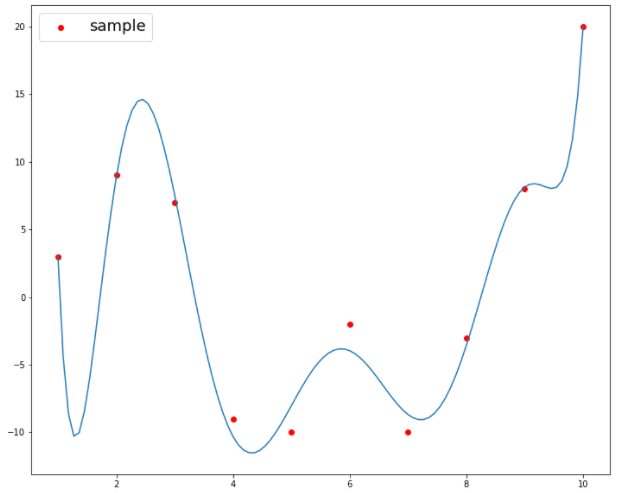
plt.scatter(x_input, y_input, color='red', label='sample')
plt.plot(x_axis, y_axis)
plt.legend(loc='upper left', fontsize=18)
if __name__ == "__main__":
x_input = [1, 2, 3, 4, 5, 6, 7, 8, 9, 10]
y_input = [3, 9, 7, -9, -10, -2, -10, -3, 8, 20]
pol_reg(x_input, y_input, 8)
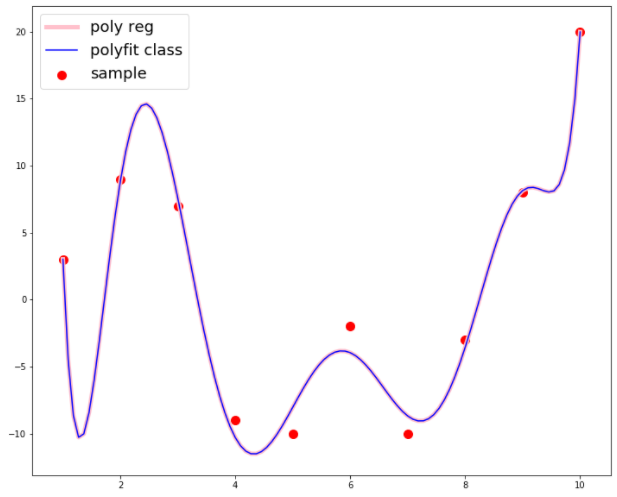
numpy.polyfit クラスとの比較
import numpy as np
import matplotlib.pyplot as plt

plt.figure(figsize=(12, 10))
def pol_reg(x_input, y_input, deg):
    l = []
    for x in x_input:
        tmp = []
        for j in range(0, deg + 1):
            tmp.append(x ** j)
        l.append(tmp)

    X = np.array(l, dtype=float)
    vector = np.array([[y] for y in y_input])
    coef = ((np.linalg.inv(X.T @ X)) @ X.T) @ vector

    x_axis = np.linspace(x_input[0], x_input[-1], 100)
    y_axis = []
    for z in x_axis:
        val = 0
        for i in range(len(coef)):
            val += coef[i][0] * z ** i
        y_axis.append(val)
    plt.plot(x_axis, y_axis, color='pink', linewidth = 5.0, label='poly reg')

def poly_fit(x_input, y_input, deg):
    coef = np.polyfit(x_input, y_input, deg)
    x_axis = np.linspace(x_input[0], x_input[-1], 100)
    y_axis = np.poly1d(coef)(x_axis)
    plt.plot(x_axis, y_axis, color='blue', label='polyfit class')


if __name__ == "__main__":
    x_input = [1, 2, 3, 4, 5, 6, 7, 8, 9, 10]
    y_input = [3, 9, 7, -9, -10, -2, -10, -3, 8, 20]
    deg = 8
    pol_reg(x_input, y_input, deg)
    poly_fit(x_input, y_input, deg)
    plt.scatter(x_input, y_input, color='red', s=100, label='sample')
    plt.legend(loc='upper left', fontsize=18)
参考記事