続き
この記事は前回の記事の続きです。
今回は2つのランダム点間の分割に加えて、近似曲線も分割してみます。
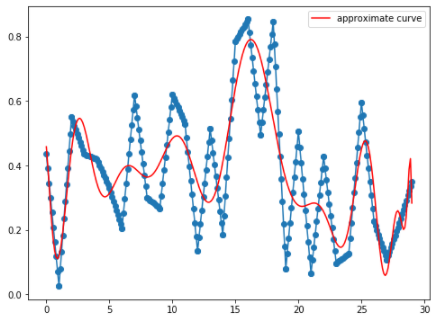
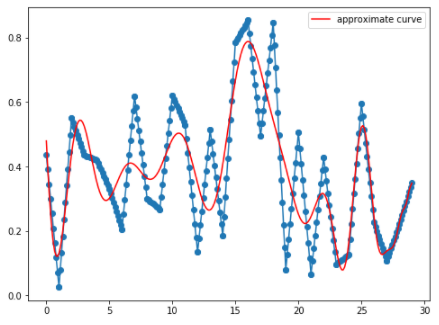
例) ランダム点が30個の場合
- ランダム点30個、次数30
極大ランダム点で極小となっていたり、その逆になったりしています。曲線の右側もおかしな極値を取っています。
- ランダム点30個、次数60
次数を倍にしてみました。曲線の右側のおかしな挙動は改善されましたが、それでもグラフ中央付近は改善が見られません。
近似曲線の分割
近似曲線を分割するため、中間ランダム点を格納したndarrayを分割します。
sample6.py
import matplotlib.pyplot as plt
import random
import numpy as np
import math

SIZE = 30
SEED = 2
DEGREE = 30
SPLIT_DISTANCE = 0.1 # 2点のランダム点の距離を0.1の長さに分割する
SPLIT_ARRAY = 3 # 中間ランダム点の分割数

def plot_split(x_val1, x_val2, y_val1, y_val2, x_medium_points, y_medium_points):
    """
    各ランダム点の中間点を生成するメソッド
    (x_val1, y_val1), (x_val2, y_val2): 2点のランダム点
    x_medium_points: 中間点のx座標をすべて格納する配列
    y_medium_points: 中間点のy座標をすべて格納する配列
    """
    # 2点のランダム点の距離を計算
    distance = math.sqrt(math.pow(x_val2 - x_val1, 2) + math.pow(y_val2 - y_val1, 2))
    # 必要な中間点の数を計算
    spl_num = math.floor(distance / SPLIT_DISTANCE)
    # 2点のランダム点を分割する. (x, y)が中間点の座標
    x_ = np.linspace(x_val1 ,x_val2, spl_num)
    y_ = np.linspace(y_val1 ,y_val2, spl_num)
    # 中間点を追加する
    x_medium_points = np.append(x_medium_points, x_)
    y_medium_points = np.append(y_medium_points, y_)
    return x_medium_points, y_medium_points


def plot_split_curve(x_medium_points, y_medium_points, DEGREE, n):
    """
    分割した中間ランダム点を描画するメソッド
    """
    coeff = np.polyfit(x_medium_points, y_medium_points, DEGREE)
    y_polyfit = np.poly1d(coeff)(x_medium_points)

    plt.plot(x_medium_points, y_medium_points, marker='o')
    if n == 0:
        plt.plot(x_medium_points, y_polyfit, label='approximate curve', color='red')
    else:
        plt.plot(x_medium_points, y_polyfit, color='red')


def plot_curve():
    """
    近似曲線を描画するメソッド
    """
    np.random.seed(seed=SEED)
    plt.figure(figsize=(8.0, 6.0))

    x = np.array(range(SIZE))
    y = np.random.rand(SIZE)
    x_medium_points = np.empty(0) # すべての中間点のx座標を格納するndarray
    y_medium_points = np.empty(0) # すべての中間点のy座標を格納するndarray
    # すべてのランダム点間を分割するループ
    for i in range(SIZE - 1):
        x_medium_points, y_medium_points = plot_split(
            x[i], x[i + 1], y[i], y[i + 1], x_medium_points, y_medium_points
        )
    # ndarrayの分割
    for n, x_split_array, y_split_array in zip(
        range(SPLIT_ARRAY),
        np.array_split(x_medium_points, SPLIT_ARRAY),
        np.array_split(y_medium_points, SPLIT_ARRAY)
    ):
        plot_split_curve(x_split_array, y_split_array, DEGREE, n)
    plt.legend()
    plt.show()

plot_curve()
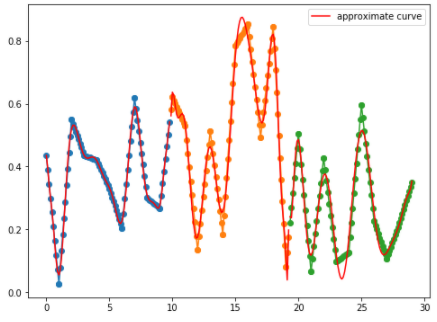
- ランダム点30個、次数30、中間ランダム点の分割数3
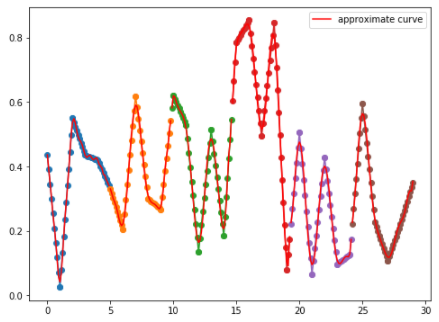
- ランダム点30個、次数30、中間ランダム点の分割数6
参考記事


