例) ランダム点が3点の場合
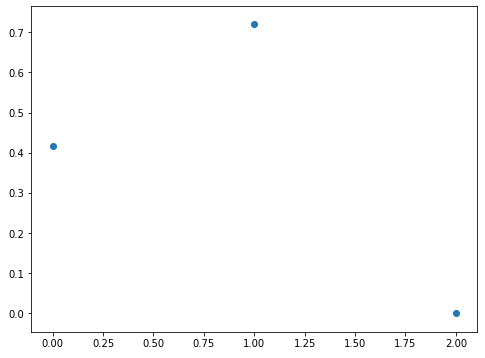
3点のランダム点の近似曲線を求めます。まずは散布図を見てみます。
import matplotlib.pyplot as plt
import numpy as np

SIZE = 3
SEED = 1

np.random.seed(seed=SEED)
plt.figure(figsize=(8.0, 6.0))

x = np.array(range(SIZE))
y = np.random.rand(SIZE)

plt.scatter(x, y)
plt.show()
- 実行結果(sample1.py)
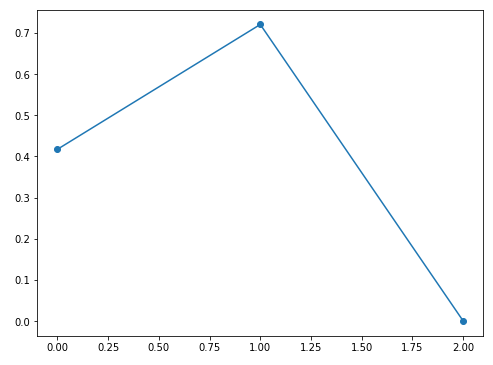
次に散布図ではなく、折れ線グラフで見てみます。
import matplotlib.pyplot as plt
import numpy as np

SIZE = 3
SEED = 1

np.random.seed(seed=SEED)
plt.figure(figsize=(8.0, 6.0))

x = np.array(range(SIZE))
y = np.random.rand(SIZE)

plt.plot(x, y, marker='o')
plt.show()
- 実行結果(sample2.py)
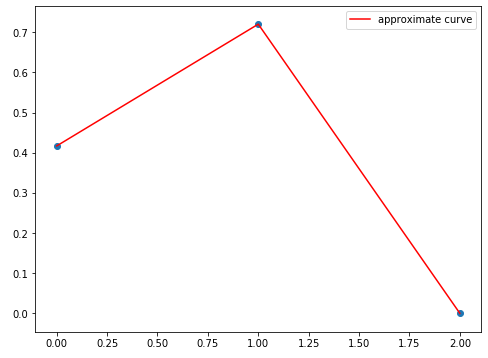
こちらをnumpyパッケージのpolyfitを使って近似してみます。こちらの記事を参考にさせて頂きました。色々な近似のやり方が取り上げられており、大変参考になります。
import matplotlib.pyplot as plt
import numpy as np

SIZE = 3
SEED = 1
DEGREE = 3

def plot_curve():
    np.random.seed(seed=SEED)
    plt.figure(figsize=(8.0, 6.0))

    x = np.array(range(SIZE))
    y = np.random.rand(SIZE)

    coeff = np.polyfit(x, y, DEGREE)
    y_polyfit = np.poly1d(coeff)(x)

    plt.scatter(x, y, marker='o')
    plt.plot(x, y_polyfit, label='approximate curve', color='red')
    plt.legend()
    plt.show()


plot_curve()
- 実行結果(sample3.py)
3次曲線ではありません。実行後に次のような警告が出ました。
RankWarning: Polyfit may be poorly conditioned
この警告が出るのはいくつか原因があります。
polyfitは、最小二乗フィットの条件が悪いときにRankWarningを発行する。これは、数値誤差のためにベストフィットがうまく定義されていないことを意味する。多項式の次数を下げたり、xをx - x.mean()で置き換えたりすることで、結果が改善されるかもしれません。rcondパラメータをデフォルトよりも小さな値に設定することもできますが、結果としてのフィットはスプリアスになる可能性があります:小さな特異値からの寄与を含めると、結果に数値的なノイズが加わる可能性があるからです。
多項式の係数のフィットは、多項式の次数が大きかったり、サンプルポイントの間隔の中心が悪かったりすると、本質的に条件が悪くなることに注意してください。このような場合、フィットの質を常にチェックする必要があります。多項式のフィットが満足のいくものではない場合、スプラインが良い代替手段となるかもしれません。
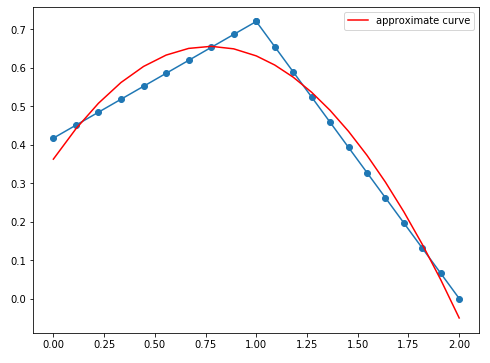
サンプルポイントの間隔が悪いようです。そこでランダム点の間に中間点をいくつか打つためのメソッドを追加しました。
import matplotlib.pyplot as plt
import random
import numpy as np
import math

SIZE = 3
SEED = 1
DEGREE = 3
SPLIT_DISTANCE = 0.1 # 2点のランダム点の距離を0.1の長さに分割する

def plot_split(x_val1, x_val2, y_val1, y_val2, x_medium_points, y_medium_points):
    """
    各ランダム点の中間点を生成するメソッド
    (x_val1, y_val1), (x_val2, y_val2): 2点のランダム点
    x_medium_points: 中間点のx座標をすべて格納する配列
    y_medium_points: 中間点のy座標をすべて格納する配列
    """
    # 2点のランダム点の距離を計算
    distance = math.sqrt(math.pow(x_val2 - x_val1, 2) + math.pow(y_val2 - y_val1, 2))
    # 必要な中間点の数を計算
    spl_num = math.floor(distance / SPLIT_DISTANCE)
    # 2点のランダム点を分割する. (x, y)が中間点の座標
    x_ = np.linspace(x_val1 ,x_val2, spl_num)
    y_ = np.linspace(y_val1 ,y_val2, spl_num)
    # 中間点を追加する
    x_medium_points = np.append(x_medium_points, x_)
    y_medium_points = np.append(y_medium_points, y_)
    return x_medium_points, y_medium_points

def plot_curve():
    """
    近似曲線を描画するメソッド
    """
    np.random.seed(seed=SEED)
    plt.figure(figsize=(8.0, 6.0))

    x = np.array(range(SIZE))
    y = np.random.rand(SIZE)
    x_medium_points = np.empty(0) # すべての中間点のx座標を格納するndarray
    y_medium_points = np.empty(0) # すべての中間点のy座標を格納するndarray
    # すべてのランダム点間を分割するループ
    for i in range(SIZE - 1):
        x_medium_points, y_medium_points = plot_split(
            x[i], x[i + 1], y[i], y[i + 1], x_medium_points, y_medium_points
        )
    coeff = np.polyfit(x_medium_points, y_medium_points, DEGREE)
    y_polyfit = np.poly1d(coeff)(x_medium_points)

    plt.plot(x_medium_points, y_medium_points, marker='o')
    plt.plot(x_medium_points, y_polyfit, label='approximate curve', color='red')
    plt.legend()
    plt.show()

plot_curve()
- 実行結果(sample4.py)
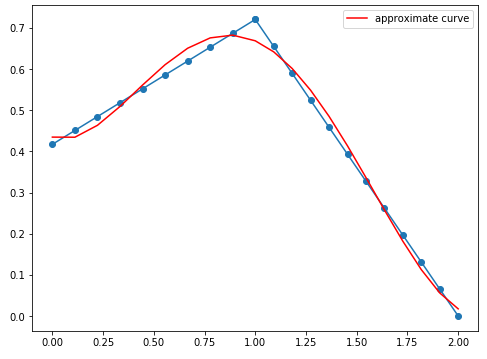
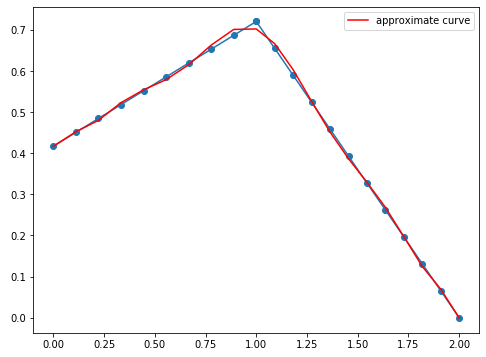
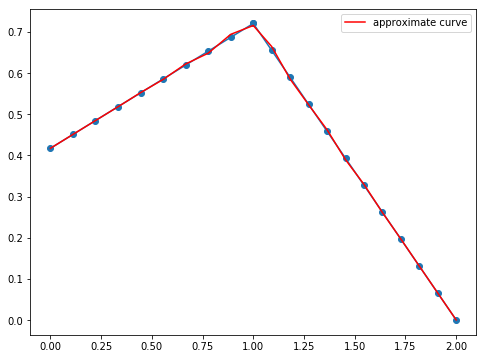
もっと次数を上げてみます。
- 次数5
- 次数10
- 次数20
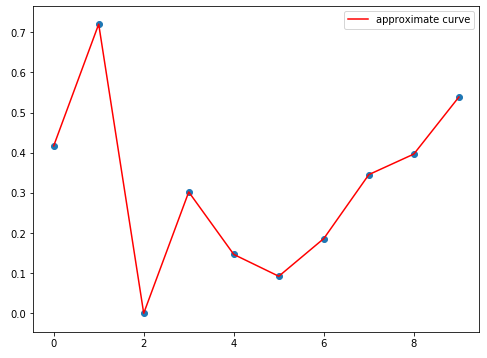
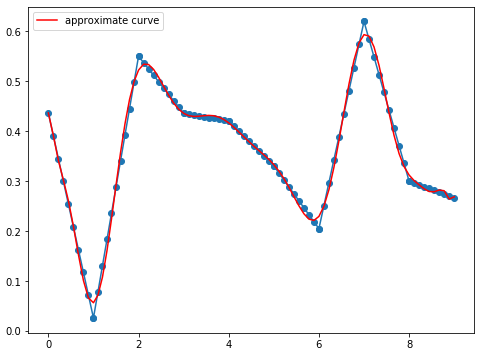
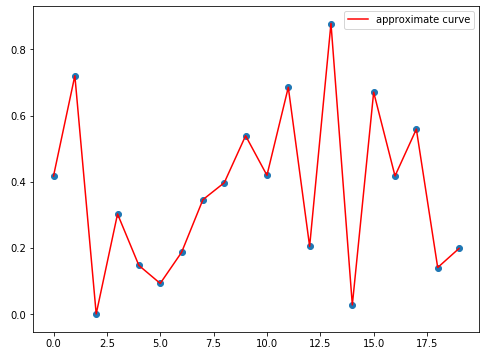
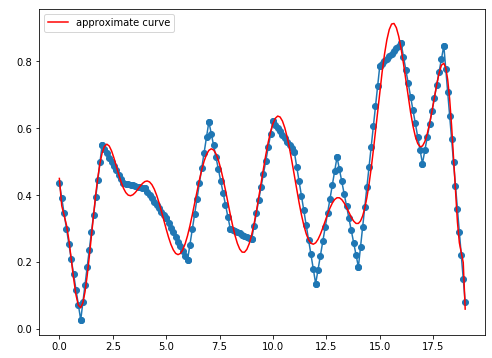
ランダム点の数を増やしてみる
SEEDは適宜変更しています。
- ランダム点10個、次数20
中間点なし
中間点あり
- ランダム点20個、次数30
中間点なし
中間点あり
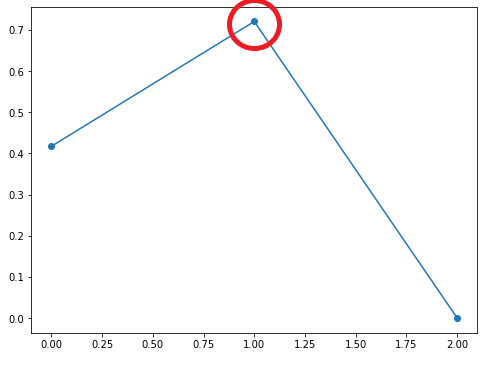
極大値に注目
近似曲線の極大値がだんだんランダム点の極大値に近づいていくことを確認してみます。ランダム点の極大値は以下のしるしをつけた部分です。
- 次数3
極大ランダム点: (1, 0.7203244934421581)
極大点: (0.772392439730853, 0.655702304440213)
2点間の距離: 0.2366035266074377
- 次数10
極大ランダム点: (1, 0.7203244934421581)
極大点: (0.948358154072993, 0.707500859951182)
2点間の距離: 0.05321020415916126
次数を上げると近似曲線の極大値がランダム点の極大値に近づいていっていることが数値からもわかります。極値の計算はこちらのサイトが大変参考になりました。
多項式の代入などはこちらのサイトがおすすめです。
検証に用いたコードを記載しておきます。
import matplotlib.pyplot as plt
import random
import numpy as np
import sympy as sym
import math

SIZE = 3
SEED = 1
DEGREE = 3
SPLIT_DISTANCE = 0.1
INF = math.inf

def plot_split(x_val1, x_val2, y_val1, y_val2, x_medium_points, y_medium_points):
    distance = math.sqrt(math.pow(x_val2 - x_val1, 2) + math.pow(y_val2 - y_val1, 2))
    spl_num = math.floor(distance / SPLIT_DISTANCE)
    x_ = np.linspace(x_val1 ,x_val2, spl_num)
    y_ = np.linspace(y_val1 ,y_val2, spl_num)
    x_medium_points = np.append(x_medium_points, x_)
    y_medium_points = np.append(y_medium_points, y_)
    return x_medium_points, y_medium_points

def plot_curve():
    np.random.seed(seed=SEED)
    plt.figure(figsize=(8.0, 6.0))

    x = np.array(range(SIZE))
    y = np.random.rand(SIZE)
    x_medium_points = np.empty(0)
    y_medium_points = np.empty(0)
    for i in range(SIZE - 1):
        x_medium_points, y_medium_points = plot_split(
            x[i], x[i + 1], y[i], y[i + 1], x_medium_points, y_medium_points
        )
    coeff = np.polyfit(x_medium_points, y_medium_points, DEGREE)
    y_polyfit = np.poly1d(coeff)(x_medium_points)

    curve = get_curve(coeff)
    critical_points = find_extremes(curve)
    evaluate_maximum(curve, x[1], y[1], critical_points)

    plt.plot(x_medium_points, y_medium_points, marker='o')
    plt.plot(x_medium_points, y_polyfit, label='approximate curve', color='red')
    plt.legend(loc='upper left')
    plt.show()

def get_curve(coeff):
    x = sym.Symbol('x')
    curve = 0
    deg = len(coeff)
    for i in range(deg):
        curve += coeff[deg - (i + 1)] * x ** i
    return curve


def find_extremes(curve):
    x = sym.Symbol('x')
    critical_points = sym.solve(sym.diff(curve, x))
    for critical_point in critical_points:
        if sym.im(critical_point) != 0\
           or SIZE < critical_point or critical_point < 0:
            continue
        extreme_value = curve.subs(x, critical_point)
        diff1 = sym.diff(curve, x)
        diff2 = sym.diff(diff1, x)
        if diff2.subs(x, critical_point) < 0:
            print('x = {}のとき極大値 f(x) = {}\n'.format(critical_point, extreme_value))
        elif diff2.subs(x, critical_point) > 0:
            print('x = {}のとき極小値 f(x) = {}\n'.format(critical_point, extreme_value))
        else:
            print('f\'\'(x)が0です')
    sym.plot(curve, (x, 0, SIZE - 1))
    return critical_points


def evaluate_maximum(curve, x_val, y_val, critical_points):
    x = sym.Symbol('x')
    min_x_val = INF
    nearest_critical_point = 0
    index = 0
    for critical_point in critical_points:
        tmp_x_difference = abs(x_val - critical_point)
        if min_x_val > tmp_x_difference:
            min_x_val = tmp_x_difference
            nearest_critical_point = critical_point
    print(
        '極大ランダム点: ({}, {})\n極大点: ({}, {})'.format(
            x_val, y_val,
            nearest_critical_point,
            curve.subs(x,  nearest_critical_point)
        )
    )
    print(
        '2点間の距離: {}'.format(
            math.sqrt(
                math.pow(x_val - nearest_critical_point, 2) + \
                math.pow(y_val - curve.subs(x, nearest_critical_point), 2)
            )
        )
    )


plot_curve()
参考記事
