概要
Grafana 2.6.0 がリリースされたので最近追加された以下のダッシュボードを設定する
- CloudWatch DataSource (2.5から)
AWS credential
Grafana が動作しているサーバに AWS credential ファイルを作成
[default]
aws_access_key_id = AKXXXXXXXXXXXX
aws_secret_access_key = XXXXXXXXXXXXXXXXXXXXXXXXXXXXXXXXXXX
region = ap-northeast-1
Grafana を rpm でインストールしている場合は、/usr/share/grafana/.aws に credential ファイルを作成
複数アカウントある場合
[dev]
aws_access_key_id = AKXXXXXXXXXXXX
aws_secret_access_key = XXXXXXXXXXXXXXXXXXXXXXXXXXXXXXXXXXX
region = ap-northeast-1

[prod]
aws_access_key_id = AKXXXXXXXXXXXX
aws_secret_access_key = XXXXXXXXXXXXXXXXXXXXXXXXXXXXXXXXXXX
region = ap-southeast-1
CloudWatch DataSource 追加
Data Sources メニューより、
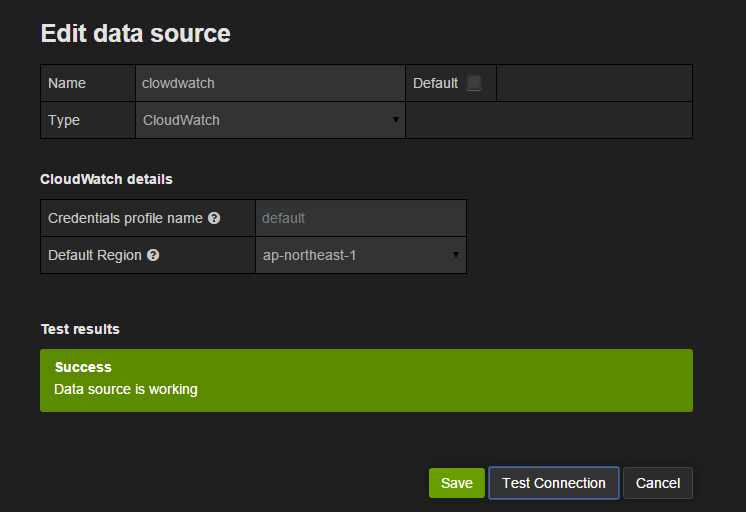
[Add new] クリック → [Type] で CloudWatch 選択 → [Name] に任意の名前入力 → [Default Region] リージョン選択 → [Add]
[Test Connection] をクリックして Success になれば完了

複数のアカウントがある場合は、[Credentials profile name]を入力
(上記の例だと dev, prod とか)
グラフ作成
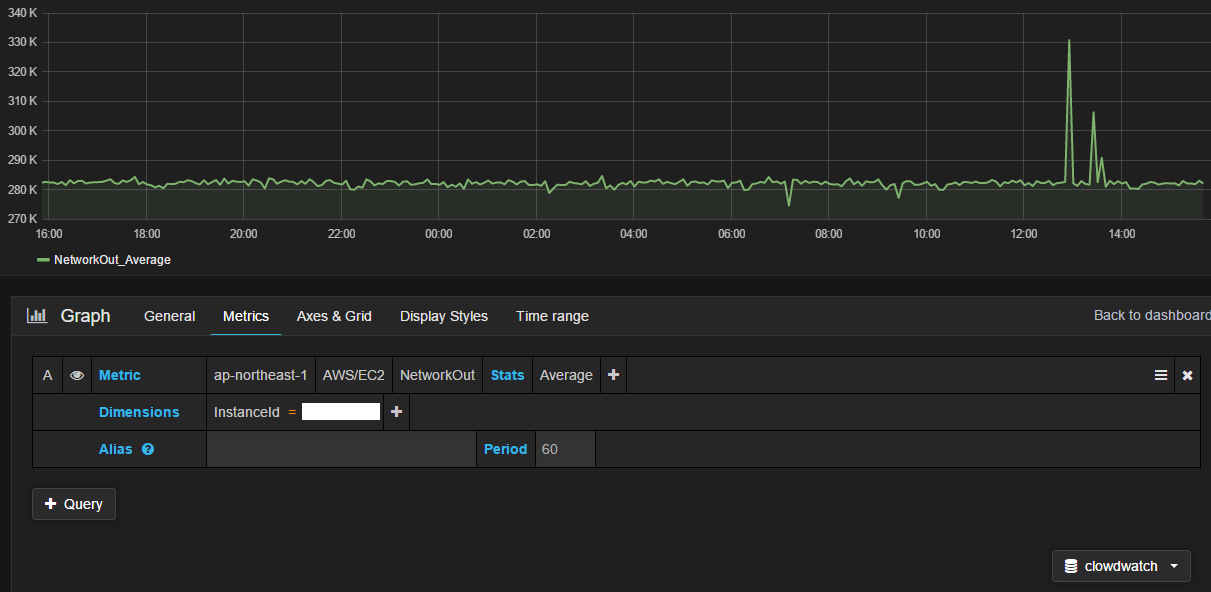
DataSouce より cloudwatch を選択してグラフを作成する
設定からグラフを作成するまでは以上
※注意点
無料枠を超えたAPIリクエストは、以下の料金が発生するため注意
Amazon CloudWatch API リクエスト
GetMetricStatistics、ListMetrics、または PutMetricData のリクエスト 1,000件あたり $0.01
