前回 collectd について触れたので、ついでに output についても記載
概要
collectd で収集したメトリクス情報を riemann でリアルタイム処理する
riemann は、イベントデータのストリーム処理エンジンで、以下の基本フィールドと任意のカスタムフィールドを付与できる
- host
- service
- state
- time
- description
- tags
- metric
- ttl
■構成
collectd -> riemann -> riemann-dash
               └> Graphite -> Grafana
メトリクスを Graphite 以外(InfluxDB, datadog 等の SaaS)にも保存したり、アラートをメール、Slack、Nagios に投げたりもできる
イメージ
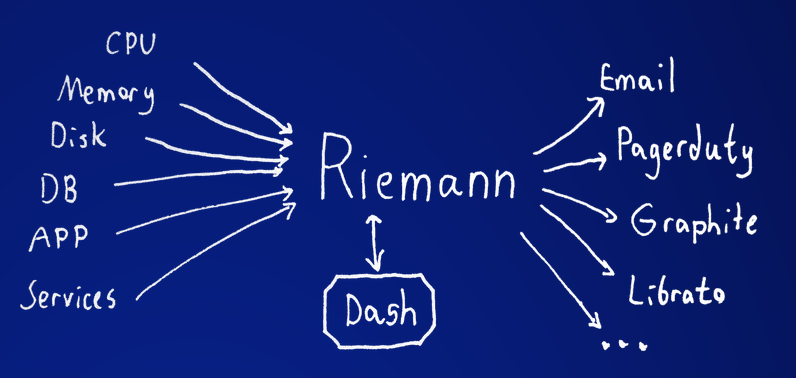
公式サイトより
riemann インストール
まずはインストール
# yum install daemonize
# rpm -ivh https://aphyr.com/riemann/riemann-0.2.10-1.noarch.rpm
riemann セットアップ
設定ファイル構成
メイン設定ファイル + 各役割でディレクトリを作成して、ファイルを分割
設定ファイルは clojure で記述
/etc/riemann/
|--riemann.config
|
|--/streams/
|    |--default.config
|    |--load.config
|
|--/filters/
|    |--collectd.config
|    |--rewrite.config
|
|--/targets/
     |--graphite.config
     |--index.config
- streams : イベントストリーム処理の設定ファイルを配置
- filters : イベントに対する変換処理の設定ファイルを配置
- target : graphite への出力等 output 関連の設定ファイルを配置
メイン設定ファイル
待ち受けポートや ディレクトリ include 等、基本設定のみ
(logging/init :file "/var/log/riemann/riemann.log")

(let [host "0.0.0.0"]
  (tcp-server  :host host) ; :port 5555
  (udp-server  :host host) ; :port 5555
  (ws-server   :host host) ; :port 5556
  (sse-server  :host host) ; :port 5558
  (repl-server :host host) ; :port 5557
)

(periodically-expire 60)

(include "filters")
(include "targets")
(include "streams")
イベントストリーム処理
デフォルトの処理
(streams
  graph
  (with { :metric 1 :service "events/sec"
      :host nil :tags nil :state nil } (rate 5 index))
  (expired
    #(info "expired" %))
)
閾値によるステータス処理
(streams
  rewrite-index
  (cpu-stream rewrite-index)
  (mem-stream rewrite-index)
  (swap-stream rewrite-index)

  (where (service #"/cpu-")
    (split
      (service #"/cpu-idle$")
        (splitp >= metric
          1  (with :state "critical" rewrite-index)
          20 (with :state "warning"  rewrite-index)
             (with :state "ok"       rewrite-index))
      :otherwise
        (splitp <= metric
          80 (with :state "critical" rewrite-index)
          40 (with :state "warning"  rewrite-index)
             (with :state "ok"       rewrite-index))
  ))

  (where (service #"/disk_")
    (split
      (service #"/disk_octets")
        (splitp <= metric
          2000 (with :state "critical" rewrite-index)
               (with :state "ok"       rewrite-index))
  ))

  (where (service #"/memory-")
    (split
      (service #"/memory-used$")
        (splitp <= metric
          30000000000 (with :state "critical" rewrite-index)
          2000000000  (with :state "warning"  rewrite-index)
                      (with :state "ok"       rewrite-index))
  ))

  (where (service #"/if_")
    (split
      (service #"/if_octets")
        (splitp <= metric
          20000 (with :state "critical" rewrite-index)
          1000  (with :state "warning"  rewrite-index)
                (with :state "ok"       rewrite-index))
  ))

)
filter処理
collectd から直接 input した場合、service 名が長かったり分かりにくいので変換処理
(load/load/shortterm → load1 等)
(defmacro mem-stream
  [& children]
  `(where* (fn [{plugin# :plugin, state# :state}]
             (and (= "memory" plugin#)
                  (not= "expired" state#)))
           (by [:host]
               (project* [(comp (partial = "used") :type_instance)
                          (comp (partial = "cached") :type_instance)
                          (comp (partial = "buffered") :type_instance)
                          (comp (partial = "free") :type_instance)]
                         (smap
                          (fn [[used# cached# buf# free#]]
                            (when (and used# cached# buf# free#)
                              (try
                                (assoc used#
                                  :service "mem used%"
                                  :metric (-> (:metric used#)
                                              (/ (+ (:metric used#)
                                                    (:metric cached#)
                                                    (:metric buf#)
                                                    (:metric free#)))
                                              (* 100)))
                                (catch Exception e#
                                  (error e# "cannot compute mem pct for " used# cached# buf# free#)
                                  nil))))
                          ~@children)))))

(defmacro cpu-stream
  [& children]
  `(where* (fn [{plugin# :plugin, plugin_instance# :plugin_instance,
                 state# :state}]
             (and (= "aggregation" plugin#)
                  (= "cpu-average" plugin_instance#)
                  (not= "expired" state#)))
     #(info %)
           (by [:host]
               (project* [(comp (partial = "user") :type_instance)
                          (comp (partial = "system") :type_intance)
                          (comp (partial = "softirq") :type_instance)
                          (comp (partial = "interrupt") :type_instance)
                          (comp (partial = "steal") :type_instance)
                          (comp (partial = "wait") :type_instance)
                          (comp (partial = "nice") :type_instance)]
                         (smap (fn [events#]
                                 (when-let [summed# (folds/sum events#)]
                                   (try
                                     (assoc summed# :service "cpu all")
                                     (catch Exception e#
                                       (error e# "cannot compute cpu all for " summed#)
                                       nil))))
                               ~@children)))))
(def default-services
  [
   {:service "conntrack/conntrack" :rewrite "conntrack"}
   {:service "load/load/shortterm" :rewrite "load1"}
   {:service "load/load/midterm" :rewrite "load5"}
   {:service "load/load/longterm" :rewrite "load15"}
   {:service "memory/memory-used" :rewrite "mem used"}
   {:service "memory/memory-free" :rewrite "mem free"}
   {:service "memory/memory-buffered" :rewrite "mem buffered"}
   {:service "memory/memory-cached" :rewrite "mem cached"}
   {:service #"^cpu-([0-9]+)/cpu-(.*)$" :rewrite "cpu-$1 $2"}
   {:service #"^aggregation-cpu-average/cpu-(.*)$" :rewrite "cpu $1"}
   {:service #"^interface-(.*)/if_(errors|packets|octets)/(tx|rx)$"
    :rewrite "nic $1 $3 $2"}
   {:service #"^apache-apache/apache_(.*)$" :rewrite "apache $1"}
   {:service #"^mysql-monitor/mysql_(.*)-(.*)$" :rewrite "mysql $2"}
   ]
)

(defn rewrite-service-with
  [rules]
  (let [matcher (fn [s1 s2] (if (string? s1) (= s1 s2) (re-find s1 s2)))]
    (fn [{:keys [service] :as event}]
      (or
       (first
        (for [{:keys [rewrite] :as rule} rules
              :when (matcher (:service rule) service)]
          (assoc event :service
                 (if (string? (:service rule))
                   rewrite
                   (clojure.string/replace service (:service rule) rewrite)))))
       event))))

(def rewrite-service
  (rewrite-service-with default-services))
output 処理
デフォルトのステートを付与
(def index
    (default {:state "ok" :ttl 300}
      (update-index (index))))

(def rewrite-index
  (smap rewrite-service index))
メトリクス を graphite へ流す
(def graph
    (graphite {:host "{graphite サーバ IP アドレス}"}))
riemann 起動
# /etc/init.d/riemann start
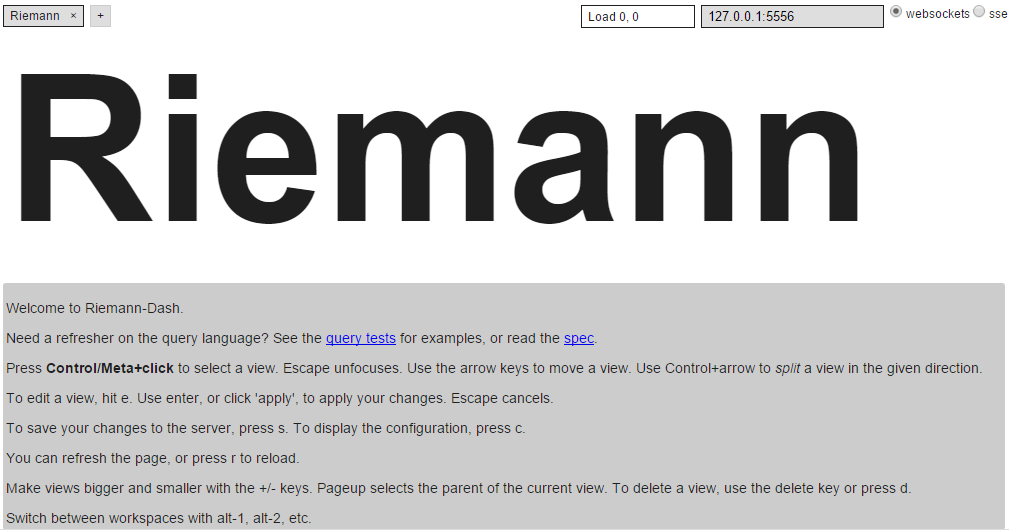
riemann-dash インストール
受け取ったイベントをリアルタイム表示するための Sinatra でできたアプリ
インストール手順
# cd /opt
# git clone https://github.com/aphyr/riemann-dash.git
# cd riemann-dash
# gem install bundler
# bundle install
float グラフ のタイムゾーン変更
# vi /opt/riemann-dash/lib/riemann/dash/public/views/flot.js
           max: this.max
         },
         xaxis: {
+          timezone: "browser",
           font: this.font,
riemann-dash 起動
# RACK_ENV=production bundle exec riemann-dash -c example/config.rb &
http://{riemann サーバ IP アドレス}:4567 にアクセス
client(collectd) セットアップ
collectd で取得するメトリクスは以下
- cpu
- apache status
- disk
- interface
- mysql
collectd インストール
# yum -y install libcurl-devel net-snmp-devel protobuf-c-devel yajl-devel
# wget http://collectd.org/files/collectd-5.5.0.tar.gz
# tar zxvf collectd-5.5.0.tar.gz
# cd collectd-5.5.0
# ./cofigure
# make; make install
collectd 設定
Hostname    "*****"
FQDNLookup   false
BaseDir     "/opt/collectd/var/lib/collectd"
PIDFile     "/opt/collectd/var/run/collectd.pid"
PluginDir   "/opt/collectd/lib/collectd"
TypesDB     "/opt/collectd/share/collectd/types.db"

Interval     5
Timeout      5
ReadThreads  10
WriteThreads 10

LoadPlugin syslog

LoadPlugin aggregation
LoadPlugin apache
LoadPlugin cpu
LoadPlugin interface
LoadPlugin load
LoadPlugin mysql
LoadPlugin memory
LoadPlugin write_riemann

<Plugin "aggregation">
  <Aggregation>
    Plugin "cpu"
    Type "cpu"
    GroupBy "Host"
    GroupBy "TypeInstance"
    CalculateAverage true
  </Aggregation>
</Plugin>

<Plugin apache>
  <Instance "apache">
    URL "http://localhost/server-status?auto"
  </Instance>
</Plugin>

<Plugin interface>
        Interface "eth0"
        IgnoreSelected false
</Plugin>

<Plugin mysql>
        <Database demo>
                Host "localhost"
                User "demo"
                Password "demo"
                Database "demo"
        </Database>
</Plugin>

<Plugin write_riemann>
        <Node "*****">
                Host "{riemann IP アドレス}"
                Port 5555
                Protocol UDP
                StoreRates true
               AlwaysAppendDS false
        </Node>
        Tag "collectd"
</Plugin>
各 client で collectd 起動
# /etc/init.d/collectd start
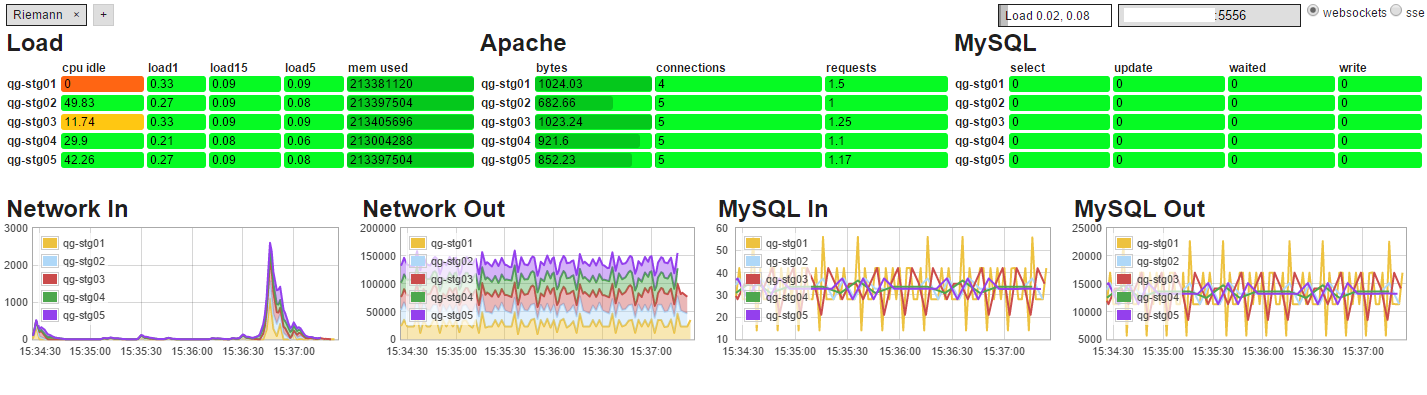
riemann-dash でメトリクスをリアルタイム表示する
collectd で取得したメトリクスのグラフをリアルタイム表示
各 view にクエリを記載する
作成したダッシュボード
ダッシュボードコンフィグ
{
"server": "{riemann サーバ IP アドレス}:5556",
"server_type": "ws",
"workspaces": [
{
"name": "Riemann",
"view": {
"type": "Balloon",
"weight": 1,
"id": "7fb2428439a04d9238de9f2fd9eff1f5910d2477",
"version": 38,
"child": {
"type": "VStack",
"weight": 1,
"id": "cc696f34d59ea1f1f996c11f09293ba5dd47567d",
"version": 38,
"children": [
{
"type": "HStack",
"weight": 1,
"id": "954004fabce0e68e0e227feb1d30aaf2aa22475b",
"version": 19,
"children": [
{
"type": "VStack",
"weight": 1,
"id": "20fc8f5754b44f9549bf5ba4525284c6017bd15d",
"version": 0,
"children": [
{
"type": "Grid",
"weight": 1,
"id": "3ef8b2f3786e2ab1ba017a66b0e2440b29c11159",
"version": 11,
"title": "Load",
"query": "tagged \"collectd\" and (service =~ \"cpu idle\" or service =~ \"load%\" or service =~ \"mem used\" or service =~ \"swap in\" or service =~ \"swap out\")",
"max": "",
"rows": "",
"cols": "",
"row_sort": "lexical",
"col_sort": "lexical"
}
]
},
{
"type": "VStack",
"weight": 1,
"id": "4e7fc05a9aaa0f2723d4ad5a4e0cdc5e40834cf5",
"version": 5,
"children": [
{
"type": "HStack",
"weight": 1,
"id": "d66f68fdbe079f699944f7d25afe5376e3906fc9",
"version": 1,
"children": [
{
"type": "Grid",
"weight": 1,
"id": "2c6bb867479df2aee7711f719c93b4895cc622c4",
"version": 1,
"title": "Apache",
"query": "tagged \"collectd\" and (service =~ \"apache requests\" or service =~ \"apache connections\" or service =~ \"apache bytes\")",
"max": "",
"rows": "",
"cols": "",
"row_sort": "lexical",
"col_sort": "lexical"
}
]
}
]
},
{
"type": "Grid",
"weight": 1,
"id": "850e41e4c5043cba5a9d332930205428b62a35e2",
"version": 2,
"title": "MySQL",
"query": "tagged \"collectd\" and (service =~ \"mysql insert\" or service =~ \"mysql select\" or service =~ \"mysql write\" or service =~ \"mysql update\" or service =~ \"mysql waited\" or service =~ \"mysql commit\")",
"max": "",
"rows": "",
"cols": "",
"row_sort": "lexical",
"col_sort": "lexical"
}
]
},
{
"type": "HStack",
"weight": 1,
"id": "2aacf97b956c8036d4dbac9947c7ea1e35224811",
"version": 17,
"children": [
{
"type": "Flot",
"weight": 1,
"id": "515eb5172d8d61dd37736a9991151e0c960c0c2e",
"version": 8,
"title": "Network In",
"query": "tagged \"collectd\" and service =~ \"nic%rx octets\"",
"min": null,
"max": null,
"timeRange": 180,
"graphType": "line",
"stackMode": "true"
},
{
"type": "Flot",
"weight": 1,
"id": "3957704a8803eebe37747de3c2a09948955bbbed",
"version": 3,
"title": "Network Out",
"query": "tagged \"collectd\" and service =~ \"nic%tx octets\"",
"min": null,
"max": null,
"timeRange": 180,
"graphType": "line",
"stackMode": "true"
},
{
"type": "Flot",
"weight": 1,
"id": "f2a30d5108a3b5f6b62666e53177f6cf212e3d7d",
"version": 5,
"title": "MySQL In",
"query": "tagged \"collectd\" and service =~ \"mysql-monitor/mysql_octets/rx\"",
"min": null,
"max": null,
"timeRange": 180,
"graphType": "line",
"stackMode": "false"
},
{
"type": "Flot",
"weight": 1,
"id": "8e16ee1e10ae604cb02dcc167ad60de53c49afe5",
"version": 5,
"title": "MySQL Out",
"query": "tagged \"collectd\" and service =~ \"mysql-monitor/mysql_octets/tx\"",
"min": null,
"max": null,
"timeRange": 180,
"graphType": "line",
"stackMode": "false"
}
]
},
{
"type": "View",
"weight": 1,
"id": "b233bf70e76f064a41de2d30f9c0651dd93cd826",
"version": 0
},
{
"type": "View",
"weight": 1,
"id": "719cf6e9ba5f20f5518ecfaaad7ab1c1faa317c1",
"version": 0
},
{
"type": "View",
"weight": 1,
"id": "08bb43ff8ec587f08f459b010b1fad0bdcf9102f",
"version": 0
}
]
}
},
"id": "d189ebe557de98af74b14ed7ccd8581b0522e449"
},
{
"name": "test1",
"view": {
"type": "Balloon",
"weight": 1,
"id": "b23298303d7ebbbfdc575809cc2bb0adae0412ac",
"version": 18,
"child": {
"type": "VStack",
"weight": 1,
"id": "22bb84c8df0c4da31d03ec6a619c2ac119c174e3",
"version": 18,
"children": [
{
"type": "HStack",
"weight": 1,
"id": "82498a58eb9aea04cf12119026dbd3dbf3aa6657",
"version": 16,
"children": [
{
"type": "Grid",
"weight": 1,
"id": "b5b362af5b973fdaa42938bf55115dd52ff1d628",
"version": 3,
"title": "CPU",
"query": "tagged \"collectd\" and service =~ \"cpu%\"",
"max": "",
"rows": "service",
"cols": "host"
},
{
"type": "VStack",
"weight": 1,
"id": "afb874aaf0d3570e5fd77941ba1329649cad0e2e",
"version": 8,
"children": [
{
"type": "Grid",
"weight": 1,
"id": "0b7d19e33b8e024a73c3ff05b23c23eac0e00dde",
"version": 2,
"title": "Memory",
"query": "tagged \"collectd\" and service =~ \"mem%\"",
"max": "",
"rows": "service",
"cols": "host"
},
{
"type": "Grid",
"weight": 1,
"id": "14485dfbf9f3a56254e446bc144d74b3481d716a",
"version": 4,
"title": "Swap",
"query": "tagged \"collectd\" and service =~ \"swap%\"",
"max": "",
"rows": "service",
"cols": "host"
},
{
"type": "Grid",
"weight": 1,
"id": "5a68afca5889e62ccbe0de689eb8b219e1fb0a12",
"version": 3,
"title": "Cassandra",
"query": "tagged \"collectd\" and service =~ \"Cassandra%\"",
"max": "",
"rows": "service",
"cols": "host"
},
{
"type": "View",
"weight": 1,
"id": "43406cd90ac7eccf35b1bb87042c764fb8ac79f6",
"version": 0
}
]
},
{
"type": "Grid",
"weight": 1,
"id": "f65df3ff7e24002766e4b5b2e1e867f5de346f04",
"version": 2,
"title": "Disk",
"query": "tagged \"collectd\" and service =~ \"disk%\"",
"max": "",
"rows": "service",
"cols": "host"
},
{
"type": "VStack",
"weight": 1,
"id": "a0d0d7e9f83c67b3838f9e32c8e8b5d3a92d33ee",
"version": 2,
"children": [
{
"type": "Grid",
"weight": 1,
"id": "270903b0bf5facb7208189511ddf4aa85b0e843e",
"version": 2,
"title": "Apache",
"query": "tagged \"collectd\" and service =~ \"apache%\"",
"max": "",
"rows": "service",
"cols": "host"
},
{
"type": "Grid",
"weight": 1,
"id": "3fd8066915af6d5b9e6e27dbe913b7ac42c5b408",
"version": 1,
"title": "NIC",
"query": "tagged \"collectd\" and service =~ \"nic%\"",
"max": "",
"rows": "service",
"cols": "host"
}
]
},
{
"type": "Grid",
"weight": 1,
"id": "79fb5169a9bbc90c8181e4fe93d34fb725c76192",
"version": 1,
"title": "MySQL",
"query": "tagged \"collectd\" and service =~ \"mysql%\"",
"max": "",
"rows": "service",
"cols": "host"
}
]
}
]
}
},
"id": "8deba7de3aea10b0d432d8c54ab53db6e4c16d2a"
}
]
}
client 側の collectd を起動したら自動でダッシュボードにノード追加される
ダッシュボードはメトリクスのグラフ表示以外にも、ログをリアルタイムで流したりリスト表示したりもできる