決定木Decision Tree:rpart.control( )
データの作成と取得
「kguの日記」さんをなぞっていきます。
まずはサンプルデータを手作業で作成し、それをread.table( )でRに取り込みます。
gender  age income  most_cost
male    22  330 food
male    25  390 food
male    29  450 food
male    31  490 beauty
male    35  520 learning
male    39  640 car
male    40  630 car
male    47  600 car
male    49  790 car
male    51  530 learning
male    53  540 learning
male    57  800 car
male    60  450 food
male    68  330 food
male    72  310 food
female  22  310 food
female  24  320 food
female  27  400 food
female  31  410 food
female  35  450 beauty
female  37  530 beauty
female  42  590 beauty
female  47  700 car
female  49  600 beauty
female  50  420 food
female  55  510 beauty
female  59  390 food
female  62  600 learning
female  63  350 food
female  79  300 food
data <- read.table("/Users/kazuki/Desktop/data.txt",header=T)
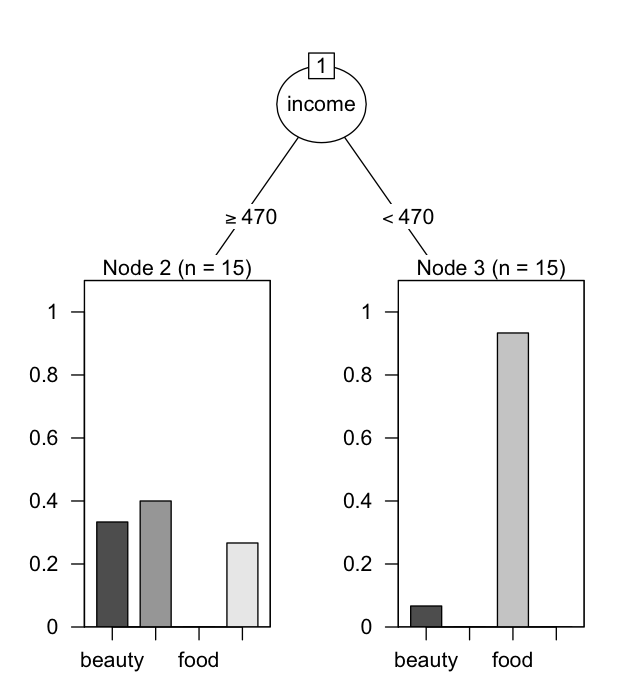
決定木decision treeの作成
rpart, partykitライブラリを用いて決定木のグラフを書きます。
> library(rpart)
> library(partykit)
rpctrl <- rpart.control(minplit=10)
> model = rpart(most_cost~., data, control=rpctrl)
> plot(as.party(model))
決定木による予測
テストデータを作成します。
gender  age income  most_cost
male    45  290     food(exp)
male    57  730     car(exp)
female  33  490     beauty(exp)
このデータから、先ほどの決定木にかけてみることで予測が可能です。(要考!)
> test <- read.table("/Users/kazuki/Desktop/test.txt",header = T)
> pred <- predict(model, test)
> pred
      beauty car      food  learning
1 0.06666667 0.0 0.9333333 0.0000000
2 0.33333333 0.4 0.0000000 0.2666667
3 0.33333333 0.4 0.0000000 0.2666667