はじめに
Rでガウス過程回帰を行うためのkernlabライブラリのgaussprを試してみたので、メモします。
基本的には上記のマニュアルに記載してあることですが、少しだけ私なりに工夫もしています。
ガウス過程回帰の特徴
この手法での回帰は、次の3つが大きな特徴のようです。
- 非線形の柔軟な予測関数が得られること
- 過学習が起きにくいこと
- 各データ領域でどの程度の予測信頼性があるかを示すことができること
理論的な解説は、本人の理解もまだ浅いのですが、MLPシリーズ「ガウス過程と機械学習」が
日本語の教科書では最も分かりやすく詳しいと思います。
また、赤穂先生の「ガウス過程回帰の基礎」もコンパクトにまとまった良い解説と思います。
Rで実装
Rではkernlabを使うことで、簡単に試すことができます。
kernlabマニュアルのP14のExampleを参考に、データの密な部分と疎な部分を作り、実行してみます。
##ライブラリの読み込みとデータ作成
library(kernlab)
# データ作成
x <- c(seq(-30, -20, 0.05), seq(-19, -15, 1),
       seq(-9, -5, 0.1), seq(-2.9, 1, 0.5),
       seq(2, 10, 2), seq(11, 14, 2),
       seq(14.1, 20, 0.05), seq(22, 30, 1))
y <- sin(x) / x + rnorm(length(x), sd=0.05)
plot(x, y, col="blue", pch=19, ylim=c(-0.5, 1.2))
ライブラリを読んで、適当にデータを作っています。
生成したデータは青点にてプロットします。(図は最後に載せています)
ガウス過程で回帰
fit <- gausspr(x, y, variance.model=T)
xtest <- seq(min(x), max(x), 0.1)
lines(xtest, sin(xtest) / xtest, col="black", lty=2, lwd=2)
lines(xtest, predict(fit, xtest), col="red", lwd=2)
lines(xtest,
      predict(fit, xtest) + 2 * predict(fit, xtest, type="sdeviation"),
      col="salmon")
lines(xtest,
      predict(fit, xtest) - 2 * predict(fit,xtest,type="sdeviation"),
      col="salmon")
polygon(c(xtest, rev(xtest)),
        c(predict(fit, xtest) + 2 * predict(fit,xtest,type="sdeviation"),
          rev(predict(fit, xtest) - 2 * predict(fit,xtest,type="sdeviation"))),
        col=adjustcolor("salmon", alpha.f=0.2), border=NA)
次にガウス過程を適用してみます。モデル作成はgausspr関数を使います。
作成したモデルで分散や標準偏差を活用したい場合は、variance.model=Tにする必要があります。
なお、一般的にはgaussprではカーネルを指定する必要があります。
デフォルトはガウスカーネルが選択されています。
予測が目的の場合は一般的にはこれで良いようですが、
状況によっては他のカーネルの選択も検討する必要があります。
カーネルの選択で、生成されるモデルの特徴が大きく変わるので、注意が必要に思います。
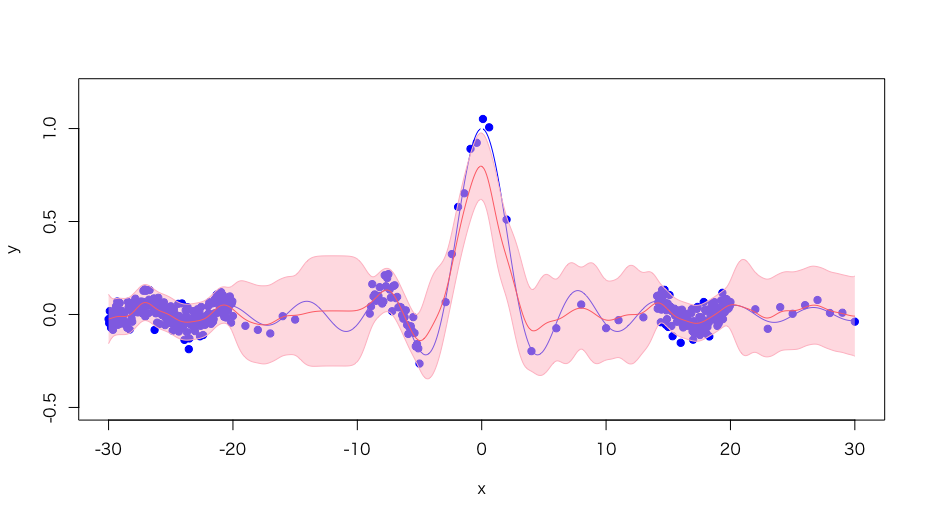
次に、青色実線で、データを生成した関数を示しています。
また、赤色実線でガウス過程回帰で予測した関数を示しています。
さらに、2seの信頼区間も表示させました。
プロット図
ということで、図を生成させてみました。
データ生成した関数とデータ点が多いところと少ないところで
信頼区間の厚みが変わっていることがわかると思います。
またデータ数を適当に変えながら実行していくと、
モデルの状況の変化が分かって面白いです。
最後に
という感じで、ホントにkernlabのさわりを試しただけの記事ですが、
機会があれば、他のカーネルを試したり、色々な生成データを使った時に、
どうなるかなどの考察も書ければとは思っています。
全Rコード
library(kernlab)
# データ作成
x <- c(seq(-30, -20, 0.05), seq(-19, -15, 1),
       seq(-9, -5, 0.1), seq(-2.9, 1, 0.5),
       seq(2, 10, 2), seq(11, 14, 2),
       seq(14.1, 20, 0.05), seq(22, 30, 1))
y <- sin(x) / x + rnorm(length(x), sd=0.05)
plot(x, y, col="blue", pch=19, ylim=c(-0.5, 1.2))

# ガウス過程で回帰
fit <- gausspr(x, y, variance.model=T)
xtest <- seq(min(x), max(x), 0.1)
lines(xtest, sin(xtest) / xtest, col="black", lty=2, lwd=2)
lines(xtest, predict(fit, xtest), col="red", lwd=2)
lines(xtest,
      predict(fit, xtest) + 2 * predict(fit, xtest, type="sdeviation"),
      col="salmon")
lines(xtest,
      predict(fit, xtest) - 2 * predict(fit,xtest,type="sdeviation"),
      col="salmon")
polygon(c(xtest, rev(xtest)),
        c(predict(fit, xtest) + 2 * predict(fit,xtest,type="sdeviation"),
          rev(predict(fit, xtest) - 2 * predict(fit,xtest,type="sdeviation"))),
        col=adjustcolor("salmon", alpha.f=0.2), border=NA)
実行環境
macOS以外は、記事執筆時点の最新版と思います。
- macOS Mojave 10.14.6
- R version 3.6.1 (2019-07-05) -- "Action of the Toes"
- RStudio Version 1.2.5019
- kernlab 0.9-27
