8
3

Delete article

Deleted articles cannot be recovered.

Draft of this article would be also deleted.

Are you sure you want to delete this article?

More than 1 year has passed since last update.

INTECAdvent Calendar 2022

Day 10

pythonでエンベロープ曲線を計算する

Last updated at Posted at 2022-02-13

はじめに

pythonでエンベロープ曲線を描きたくなったので、備忘録として。

エンベロープ曲線とは

信号包絡線(エンベロープ)は、信号の上部だけに接するような曲線で、ピーク検出に使います。
イメージとRコード例は下記が参考になります。

pythonコード

pythonでやるには、scipy.signal.hilbertの結果の絶対値を取るだけでできます。

import numpy as np
from scipy import signal
import matplotlib.pyplot as plt

#適当な波形を作成
dt = 0.01
t = np.arange(0, 1, dt)
x = np.cos(2*np.pi * 50 * t)
x *= (1 + 0.7 * np.sin(2*np.pi * 3 * t))

#エンベロープ曲線を作成
x_env = np.abs(signal.hilbert(x))

#作図
plt.plot(t, x, label="x")
plt.plot(t, x_env, label="envelope")
plt.legend()
plt.show()

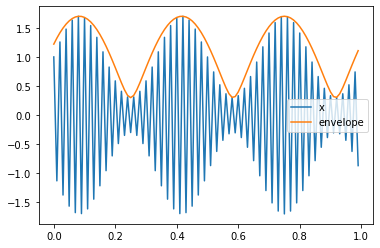
上コードの実行結果が下の図です。

2ccb5bbc-36a5-4dce-8de5-e988c50381f2.png

いい感じ!簡単ですが以上です。

実行環境

  • Mac OS 11.6.3
  • VS Code 1.64.2
  • Python 3.9.7
  • Numpy 1.20.1
  • Scipy 1.6.1
  • Matplotlib 3.3.4

参考文献

8
3
0

Register as a new user and use Qiita more conveniently

  1. You get articles that match your needs
  2. You can efficiently read back useful information
  3. You can use dark theme
What you can do with signing up
8
3

Delete article

Deleted articles cannot be recovered.

Draft of this article would be also deleted.

Are you sure you want to delete this article?