はじめに
時系列データには、一定の周期を持つデータを扱うことが良くあります。そのデータを扱う際は、いくつかの成分に分解することで、より良い分析を進めることが出来ます。Rではstlという関数を使うことが一般的です。
stlについて
stl(Seasonal Decomposition Of Time Series By Loess)は次のモデルを考えて、それぞれのデータに分解することが出来ます。
- トレンド(Trend): 長期的に変動する要素
- 周期変動(Seasonal): 一定の時間で周期的に変動する要素
- 残差(Remainder): 残りの細かく変動する要素
なので、「元データ=トレンド+周期変動+残差」となります。
stlについてのより詳しい説明やアルゴリズムついては、この論文参照ください。
Rで実施してみる
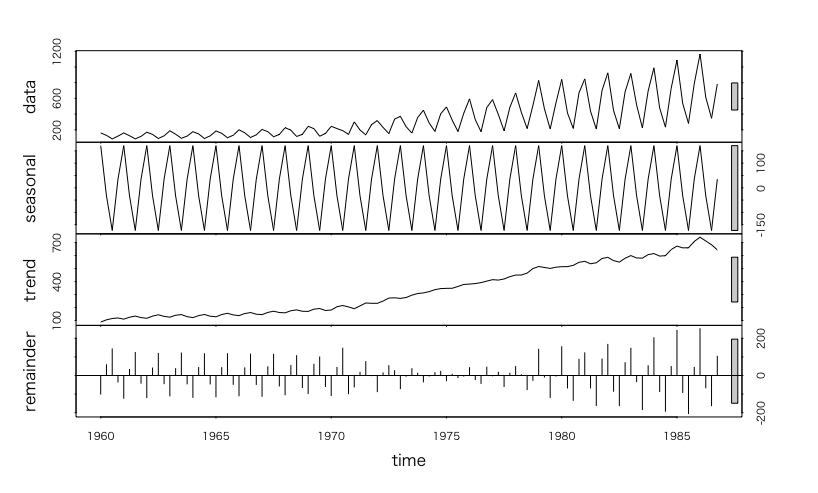
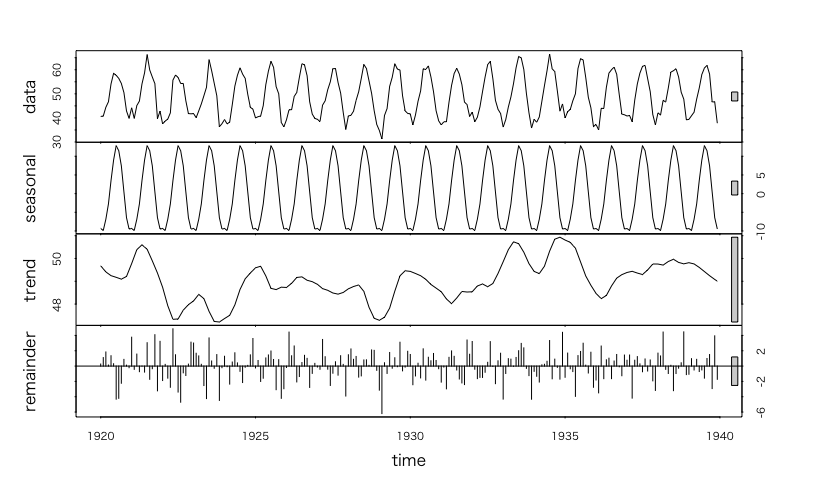
UKgas(イギリスのガス消費量)とnottem(イギリスの町の20年分の月次平均気温)をstlで分解し可視化してみます。
> ukgas.stl <- stl(UKgas, s.window ="per")
> plot(ukgas.stl)
季節変動とトレンドが綺麗に取れました。残差の変動も興味深く見えます。
なお、各成分をデータとして取り出したいときは、次のようにすれば良いです。
ukgas.stl <- stl(UKgas, s.window ="per")
#周期成分
ukgas.seasonal <- ukgas.stl$time.series[,1]
#トレンド成分
ukgas.trend <- ukgas.stl$time.series[,2]
#残差
ukgas.remainder <- ukgas.stl$time.series[,3]
次はnottemのデータで行います。
> nottem.stl <- stl(nottem, s.window ="per")
> plot(nottem.stl)
トレンドに注目することで、いつもとは違う変化に注目できるかも知れません。
より詳しい使い方はhelp(stl)でご確認ください。
最後に
このような感じでstlで周期データを分解することで、あなたが持つ仮説を示すことの助けになるかも知れません。

