SVD(特異値分解)
SVD(特異値分解)とは?
SVD(特異値分解)は、任意の行列を3つの行列に分解する数学的手法です。以下のように表される:
$$
A = U \Sigma V^T
$$
- ( A ): 元の行列(サイズ ( m \times n ))
- ( U ): 左特異ベクトルの行列(サイズ ( m \times m ))
- ( \Sigma ): 特異値(行列 ( A ) の重要性を表す数値)の対角行列(サイズ ( m \times n ))
- ( V^T ): 右特異ベクトルの行列(サイズ ( n \times n ))
特徴
- 次元削減: 元の行列の重要な情報を保持しつつ、次元を削減できます(特異値が小さい部分を切り捨てる)。
- ランク近似: データを効率よく近似するために使用されます。
- 幅広い用途: 画像圧縮、推薦システム、ノイズ除去、行列補完など。
SVDの意義
SVD は、複雑なデータを「基本成分」に分解し、そのデータの構造を簡潔に表現する強力な手法。
サンプルコード
import numpy as np
import matplotlib.pyplot as plt
from sklearn.decomposition import TruncatedSVD
from sklearn.datasets import load_digits

# データセットをロード
digits = load_digits()
X = digits.data
y = digits.target

# SVDで次元削減
n_components = 2  # 次元を2に削減
svd = TruncatedSVD(n_components=n_components)
X_reduced = svd.fit_transform(X)

# 結果を可視化
plt.figure(figsize=(10, 8))
for i in np.unique(y):
    plt.scatter(X_reduced[y == i, 0], X_reduced[y == i, 1], label=f'Digit {i}', alpha=0.7)

plt.title('2D Visualization of Digits Data Using SVD', fontsize=16)
plt.xlabel('SVD Component 1', fontsize=12)
plt.ylabel('SVD Component 2', fontsize=12)
plt.legend()
plt.grid(True)
plt.show()
- SVD(特異値分解)を使用して時限削減を行い、手書きデータセットを2次元にプロジェクション。次元削減後でも各数値のクラスターを視覚的に区別できる。
| 特徴 | SVD | PCA |
|---|---|---|
| 数学的基礎 | 特異値分解(任意の行列) | 固有値分解(共分散行列) |
| 入力データ | 任意の行列 | 標準化されたデータ |
| 主な目的 | 行列分解、ランク近似、データ解析 | 次元削減、分散の最大化 |
| 前処理 | 必須ではない | 標準化が必要 |
| 応用範囲 | 幅広い(画像圧縮、行列補完など) | 主に次元削減 |
LDA(Latent Dirichlet Allocation)
LDA(Latent Dirichlet Allocation)は自然言語処理において文書を分類するトピックモデルで用いられる手法。
from sklearn.decomposition import LatentDirichletAllocation
from sklearn.feature_extraction.text import CountVectorizer
import matplotlib.pyplot as plt
import pandas as pd

# サンプルデータ(文書のリスト)
documents = [
    "I love machine learning and natural language processing",
    "Natural language processing is a fascinating field of AI",
    "Machine learning is used in many AI applications",
    "Deep learning is a subset of machine learning",
    "Text mining and NLP are closely related fields",
    "AI techniques like machine learning and NLP are widely used"
]

# 文書をBag-of-Words(BoW)に変換
vectorizer = CountVectorizer(stop_words='english')
X = vectorizer.fit_transform(documents)

# LDAモデルの適用
n_topics = 2  # トピック数
lda = LatentDirichletAllocation(n_components=n_topics, random_state=42)
lda.fit(X)

# 各文書のトピック分布
doc_topic_distributions = lda.transform(X)

# 結果の可視化
topics = [f"Topic {i+1}" for i in range(n_topics)]
doc_indices = [f"Doc {i+1}" for i in range(len(documents))]
doc_topic_df = pd.DataFrame(doc_topic_distributions, columns=topics, index=doc_indices)

# 可視化
ax = doc_topic_df.plot(kind="bar", stacked=True, figsize=(10, 7), colormap="viridis")
plt.title("Document-Topic Distribution", fontsize=16)
plt.xlabel("Documents", fontsize=12)
plt.ylabel("Topic Proportion", fontsize=12)
plt.legend(title="Topics")
plt.tight_layout()
plt.show()
- トピックモデルとは、大量の文書データの中から、文書の構造を「トピック(話題)」という隠れたテーマを軸に分類する手法の総称。
- トピック分布の生成については、確率ベクトルの考え方を応用。
主な応用例
- ニュースや記事の分類
- 検索エンジンの最適化
- SNSやレビューの感情分析
- 研究論文や文献の要約
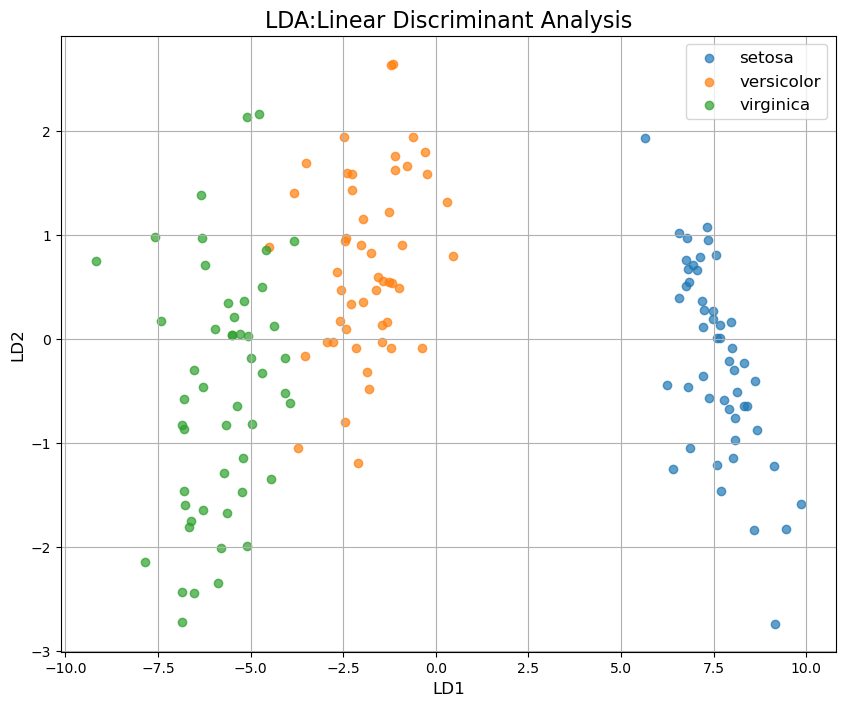
LDA(線形判別分析 Linear Discriminant Analysis)
分類タスクについて教師ありで時限削減を行う方法。
サンプルコード
from sklearn.datasets import load_iris
from sklearn.discriminant_analysis import LinearDiscriminantAnalysis
import matplotlib.pyplot as plt
import pandas as pd

# データセットのロード(Irisデータセット)
iris = load_iris()
X = iris.data  # 特徴量
y = iris.target  # クラスラベル
target_names = iris.target_names  # クラス名

# LDAの適用
lda = LinearDiscriminantAnalysis(n_components=2)  # 2次元に削減
X_lda = lda.fit_transform(X, y)

# 結果を可視化
plt.figure(figsize=(10, 8))
for i, target_name in enumerate(target_names):
    plt.scatter(
        X_lda[y == i, 0], X_lda[y == i, 1],
        alpha=0.7, label=target_name
    )

plt.title('LDA: Linear Discriminant Analysis', fontsize=16)
plt.xlabel('LD1', fontsize=12)
plt.ylabel('LD2', fontsize=12)
plt.legend(loc='best', fontsize=12)
plt.grid(True)
plt.show()
時限削減の仕組みのイメージ
- 各クラスの平均(重心)を決める
- クラスの重心同士ができるだけ離れる方向を見つける
- 各クラス内のデータがなるべく集まる方向を見つける
- これらを両立するようにデータを射影する
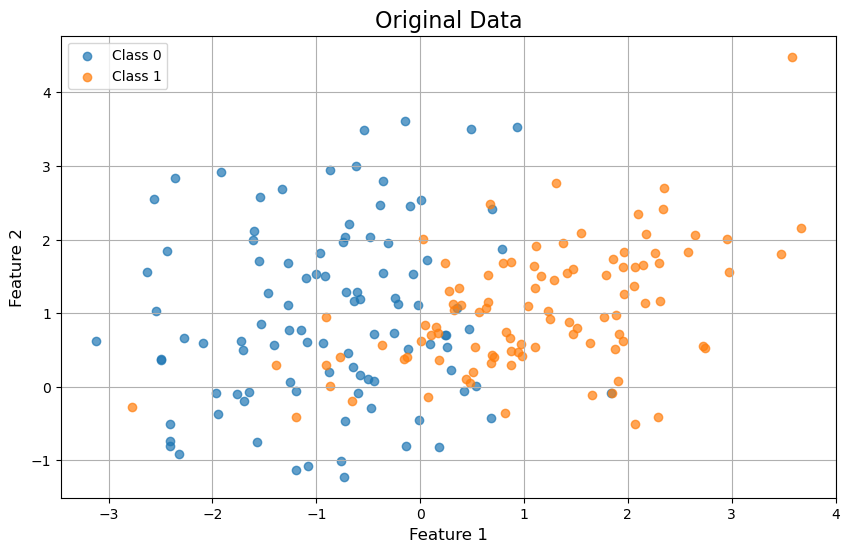
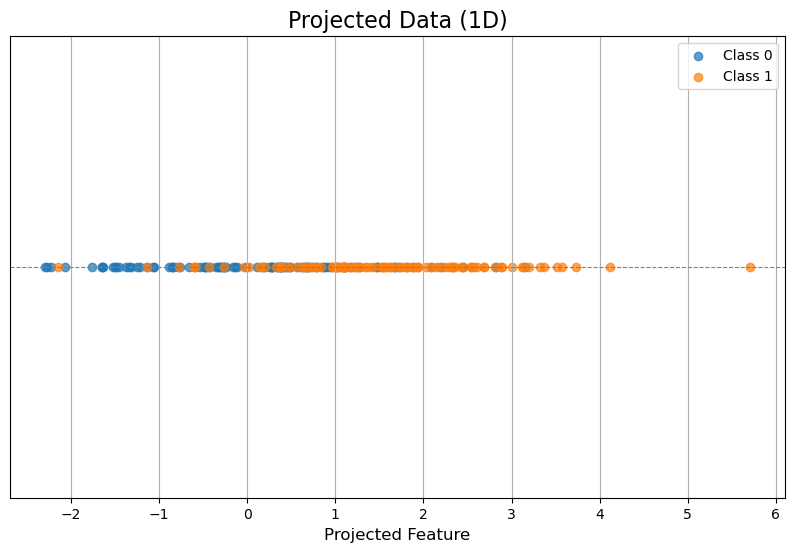
射影を行うしくみの直感的理解
import numpy as np
import matplotlib.pyplot as plt
from sklearn.datasets import make_classification

# サンプルデータの作成
X, y = make_classification(
    n_samples=200, n_features=2, n_informative=2, n_redundant=0, n_clusters_per_class=1, random_state=42
)

# データを可視化
plt.figure(figsize=(10, 6))
plt.scatter(X[y == 0, 0], X[y == 0, 1], label='Class 0', alpha=0.7)
plt.scatter(X[y == 1, 0], X[y == 1, 1], label='Class 1', alpha=0.7)
plt.title("Original Data", fontsize=16)
plt.xlabel("Feature 1", fontsize=12)
plt.ylabel("Feature 2", fontsize=12)
plt.legend()
plt.grid(True)
plt.show()

# 射影を行う方向(例:適当に選んだ方向)
w = np.array([1, 1])  # 射影する方向
w = w / np.linalg.norm(w)  # 正規化

# 射影後のデータ
X_projected = X.dot(w)

# 射影結果を可視化
plt.figure(figsize=(10, 6))
plt.scatter(X_projected[y == 0], np.zeros_like(X_projected[y == 0]), label='Class 0', alpha=0.7)
plt.scatter(X_projected[y == 1], np.zeros_like(X_projected[y == 1]), label='Class 1', alpha=0.7)
plt.axhline(0, color='gray', linestyle='--', linewidth=0.8)
plt.title("Projected Data (1D)", fontsize=16)
plt.xlabel("Projected Feature", fontsize=12)
plt.yticks([])
plt.legend()
plt.grid(True)
plt.show()
- おもしろい!2次元データを射影することによってデータを1次元に射影することができた。
- そもそも射影とは、文字の通り、あるデータを特定の次元や方向に「写す」こと。数学的にはデータのある空間から、低次元の空間(線や平面など)にデータを変換する操作。
- 数学的には、射影は次のように定義されます。
点 ( \mathbf{x} ) をベクトル ( \mathbf{w} ) に射影する場合
点 ( \mathbf{x} ) を特定の方向(ベクトル ( \mathbf{w} ))に写すと、その「影」は次の式で表される:
$$
\text{射影} = \frac{\mathbf{x} \cdot \mathbf{w}}{|\mathbf{w}|^2} \mathbf{w}
$$
ちなみに射影の考え方をビジネスに応用できるか・・・?
ビジネスデータ(マーケティング費用と顧客エンゲージメント)の2次元空間を「売上に関連する方向(射影方向)」に投射した結果を示す。
import numpy as np
import matplotlib.pyplot as plt
import pandas as pd

# サンプルデータ: 売上データとマーケティング施策の投入比率
data = {
    "Sales": [200, 220, 250, 270, 300, 320],
    "Marketing_Spend": [50, 60, 70, 80, 90, 100],
    "Customer_Engagement": [70, 75, 80, 85, 90, 95]
}
df = pd.DataFrame(data)

# 特徴量データ
X = df[["Marketing_Spend", "Customer_Engagement"]].values

# 射影方向(例: 売上に対する重みを設定)
projection_vector = np.array([0.7, 0.3])  # 売上に基づく重み
projection_vector = projection_vector / np.linalg.norm(projection_vector)  # 正規化

# 射影を計算
projected_values = X.dot(projection_vector)

# 射影された結果をデータフレームに追加
df["Projected_Value"] = projected_values

# 可視化: 元データと射影結果
plt.figure(figsize=(10, 6))

# 元の2次元データのプロット
plt.scatter(X[:, 0], X[:, 1], color="blue", alpha=0.7, label="Original Data")
for i, txt in enumerate(df["Sales"]):
    plt.annotate(txt, (X[i, 0], X[i, 1]))

# 射影方向の線を追加
x_range = np.linspace(min(X[:, 0]), max(X[:, 0]), 100)
y_range = (projection_vector[1] / projection_vector[0]) * x_range
plt.plot(x_range, y_range, color="red", linestyle="--", label="Projection Direction")

# 射影結果のプロット
for i in range(len(X)):
    plt.plot([X[i, 0], projected_values[i] * projection_vector[0]],
             [X[i, 1], projected_values[i] * projection_vector[1]],
             color="gray", linestyle=":", alpha=0.6)

# グラフの設定
plt.title("Projection of Business Data onto Sales-Relevant Direction", fontsize=16)
plt.xlabel("Marketing Spend", fontsize=12)
plt.ylabel("Customer Engagement", fontsize=12)
plt.legend()
plt.grid(True)
plt.show()
- 赤い破線が「売上に関する方向」を示す。
- 各データ点から射影方向への「影」(射影結果)は、統合指標としての売上関連度を示す。
ビジネスコンテキストで射影によって何ができるか?
1. ビジネス指標の統合
- マーケティング施策や顧客エンゲージメントなど、複数の要因を1つの指標(射影値)に統合。
- 射影方向の重みは、売上や利益への影響度合いに基づいて設定でる。
2. 意思決定の簡略化
- 複雑な多次元データを1次元に射影することで、シンプルにパフォーマンスを評価可能。
- 射影結果を元に、最も効率的な施策を特定。
3. リソース配分の最適化
- 射影後の値が高いデータポイントにリソースを集中させるなど、投資効果を最大化するための意思決定に利用できる。
もう少し射影について詳しくみてみる
import numpy as np
import matplotlib.pyplot as plt

# サンプルデータの生成(2次元データ)
np.random.seed(42)
data = np.random.rand(50, 2) * 10  # 0から10の範囲でランダムに生成

# 射影方向(任意の方向ベクトルを設定)
projection_vector = np.array([1, 2])  # 射影方向
projection_vector = projection_vector / np.linalg.norm(projection_vector)  # 正規化

# 射影計算
projected_points = np.dot(data, projection_vector)[:, None] * projection_vector

# 可視化
plt.figure(figsize=(10, 8))

# 元のデータ点
plt.scatter(data[:, 0], data[:, 1], color='blue', alpha=0.7, label='Original Data')

# 射影方向の線を描画
x_range = np.linspace(min(data[:, 0]), max(data[:, 0]), 100)
y_range = (projection_vector[1] / projection_vector[0]) * x_range
plt.plot(x_range, y_range, color='red', linestyle='--', label='Projection Direction')

# 射影された点をプロット
for i in range(len(data)):
    plt.plot([data[i, 0], projected_points[i, 0]],
             [data[i, 1], projected_points[i, 1]],
             color='gray', linestyle=':', alpha=0.6)
plt.scatter(projected_points[:, 0], projected_points[:, 1], color='green', alpha=0.7, label='Projected Points')

# グラフの設定
plt.title("Detailed Visualization of Projection", fontsize=16)
plt.xlabel("Feature 1", fontsize=12)
plt.ylabel("Feature 2", fontsize=12)
plt.legend()
plt.grid(True)
plt.show()
- 射影は高次元データを低次元に変換する基本的な操作。
- 上記の例では、データが射影方向に集約される様子が確認できる。
- 実際のビジネスや科学では、このような射影を利用して次元を削減し、データの本質を理解したり可視化を行ったりする。


