はじめに
今回はプリザンターの数値項目に対してExcelのデータバーのような棒グラフを表示する方法を紹介します。
実装してみる
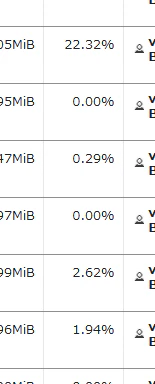
今回はこのような数値項目に対してデータバーを表示させてみます。サーバスクリプトでの実装となります。
データバーを表示させるスクリプト
columns.NumD.RawText = `<svg xmlns="http://www.w3.org/2000/svg" width="100" height="33">
   <text x="0" y="13">${model.NumD}%</text>
   <rect x="0" y="20" width="${100 - model.NumD}" height="10" fill="none" stroke="#000"></rect>
   <rect x="${100 - model.NumD}" y="20" width="${model.NumD}" height="10" fill="#f00" stroke="#000"></rect>
</svg>`;
行表示の前の条件で表示させるとこのようになります。
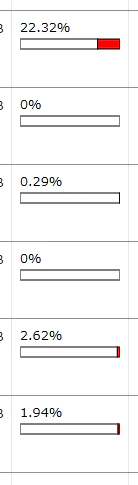
いい感じですね。RawTextを使ってSVGを直接書き出しています。ポイントは四角を2個左右に描画させることで百分率であることをわかりやすくしています。
まとめ
今回はデータバーを表示させる方法を紹介しました。今回紹介したRawTextを使ってSVGを直接描画する方法を応用すると円グラフを描画したり簡単な折れ線グラフを表示したりといろいろなグラフをおこなうことが出来ます。是非試してみてください。