Flask可視化アプリのテスト中(curl)に下記ウォーニングに遭遇しました。
UserWarning: Starting a Matplotlib GUI outside of the main thread will likely fail.
スマホの赤枠部分のプロット画像の取得テストをアプリ開発環境で実施
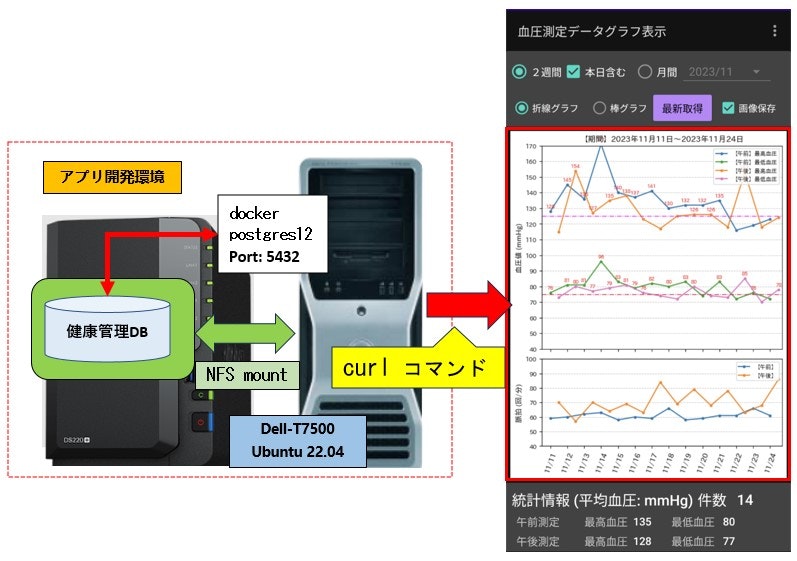
今回はFlaskでmatplotlib.pyplotインターフェスを使う上での注意点と解決策を解説します。
自作の健康管理アプリの可視化画像取得テストを curl 実行したときのコンソール出力
$ curl -G -d 'emailAddress=user1%40examples.com&yearMonth=2023-06&userTarget=130%2C85' \
> -H 'X-Request-Phone-Token:__your_make_token_abcdefghijklmnopqrstuvwxz' \
> -H 'X-Request-Image-Size:1020x1700x2.75' \
> http://dell-t7500.local:5000/healthcare/getplot_bloodpress_line_ym_forphone
こちらがログに出力されたウォーニングログ ※見やすくするため改行を入れています。
[パス省略]/plotter_bloodpressureline.py:361:
UserWarning: Starting a Matplotlib GUI outside of the main thread will likely fail.
  fig, (ax_press, ax_pulse) = plt.subplots(
192.168.0.101 - - [29/Jul/2023 14:44:21] "GET /healthcare/getplot_bloodpress_line_ym_forphone?
emailAddress=user1%40examples.com&yearMonth=2023-06&userTarget=130,85 HTTP/1.1" 200 -
1. 原因究明
【問題の箇所】 plt.subplots(...)
import matplotlib.pyplot as plt

fig, (ax_top, ax_main) = plt.subplots(
    2, 1, gridspec_kw={'height_ratios': GRID_SPEC_HEIGHT_RATIO}, layout='constrained',
    figsize=(fig_width_inch, fig_height_inch)
)
1-1. ウォーニングを出力したmatplotlibのソースの特定
python仮想環境ディレクトリで grepコマンドでソースコードを特定 ※ 改行しています
pyplot.py であるかとがわかります
$ grep "Matplotlib GUI outside" -rnI  ~/py_venv/py38_raspi4/lib/python3.8/
~/py_venv/py38_raspi4/lib/python3.8/site-packages/matplotlib/pyplot.py:376:
   "Starting a Matplotlib GUI outside of the main thread will likely "
1-2. ウォーニングを出力した実装箇所を確認
ソースコードのコメントを見るとGUI以外のメインスレッドから呼び出されウォーニングが出力されたように思われます
_get_backend_mod() がなにかありそうなので公式ドキュメントをあたってみます。
def _warn_if_gui_out_of_main_thread():
    warn = False
    if _get_required_interactive_framework(_get_backend_mod()):
        if hasattr(threading, 'get_native_id'):
            # This compares native thread ids because even if Python-level
            # Thread objects match, the underlying OS thread (which is what
            # really matters) may be different on Python implementations with
            # green threads.
            if threading.get_native_id() != threading.main_thread().native_id:
                warn = True
        else:
            # Fall back to Python-level Thread if native IDs are unavailable,
            # mainly for PyPy.
            if threading.current_thread() is not threading.main_thread():
                warn = True
    if warn:
        _api.warn_external(
            "Starting a Matplotlib GUI outside of the main thread will likely "
            "fail.")

# This function's signature is rewritten upon backend-load by switch_backend.
def new_figure_manager(*args, **kwargs):
    """Create a new figure manager instance."""
    _warn_if_gui_out_of_main_thread()
    return _get_backend_mod().new_figure_manager(*args, **kwargs)
Figure関数定義の Notes にもヒントが有ります。
#    ...一部省略...
## Figures ##

@_api.make_keyword_only("3.6", "facecolor")
def figure(num=None,  # autoincrement if None, else integer from 1-N
           figsize=None,  # defaults to rc figure.figsize
           dpi=None,  # defaults to rc figure.dpi
           facecolor=None,  # defaults to rc figure.facecolor
           edgecolor=None,  # defaults to rc figure.edgecolor
           frameon=True,
           FigureClass=Figure,
           clear=False,
           **kwargs
           ):
#    ...一部省略...
    Notes
    -----
    A newly created figure is passed to the `~.FigureCanvasBase.new_manager`
    method or the `new_figure_manager` function provided by the current
    backend, which install a canvas and a manager on the figure.
1-3. アプリケーションログを確認
[MainThread] とリクエストのスレッドの違いに注目してください。
※見やすくするため改行を入れています
# Flaskサーバーのメインスレット
2023-07-31 19:57:27,181 INFO [MainThread] run.py(15)[<module>] run.py in host: dell-t7500.local, port: 5000
2023-07-31 19:57:27,181 INFO [MainThread] run.py(31)[<module>] Development start, with debug.
2023-07-31 19:57:27,589 INFO [MainThread] __init__.py(54)[<module>] SERVER_HOST: dell-t7500.local:5000
#...途中省略...
# ここからリクエストスレッド: リクエストが curl コマンドから実行されたことが UAでわかります
2023-07-31 20:00:25,096 DEBUG [Thread-2 (process_request_thread)] app_main.py(225)[getPlotBloodPressLineYearMonthForPhone]
 /healthcare/getplot_bloodpress_line_ym_forphone
2023-07-31 20:00:25,096 DEBUG [Thread-2 (process_request_thread)] app_main.py(226)[getPlotBloodPressLineYearMonthForPhone]
 {'emailAddress': 'user1@examples.com', 'yearMonth': '2023-06'}
2023-07-31 20:00:25,096 DEBUG [Thread-2 (process_request_thread)] app_main.py(731)[_checkRequireCommonForGetImage]
headers: Host: dell-t7500.local:5000
User-Agent: curl/7.81.0
Accept: */*
X-Request-Image-Size: 1020x1700x2.75
1-4. 公式ドキュメントの確認
backend をキーワードに公式ドキュメントをみつけました。
(Matplotlib) Using Matplotlib > Figures and backends > Backends
最初にバックエンドの選択について 原文 (英語) の抜粋を示します
Selecting a backend
# 一部省略
Without a backend explicitly set, Matplotlib automatically detects a usable
backend based on what is available on your system and on whether a GUI event loop
is already running. The first usable backend in the following list is selected:
MacOSX, QtAgg, GTK4Agg, Gtk3Agg, TkAgg, WxAgg, Agg. The last, Agg, is
a non-interactive backend that can only write to files.
# 一部省略
以下が Google翻訳の日本語 ※ヒントはここのようです。
バックエンドを明示的に設定しない場合、Matplotlib は、システムで利用可能なものと GUI イベント ループが
すでに実行されているかどうかに基づいて、使用可能なバックエンドを自動的に検出します。
次のリストの最初の使用可能なバックエンドが選択されます: MacOSX、QtAgg、GTK4Agg、Gtk3Agg、
TkAgg、WxAgg、Agg。 最後の Agg は、ファイルへの書き込みのみが可能な非対話型バックエンドです。
デフォルトのバックエンド(GUI)を使わない場合、matplotlib.use() を設定する
# 一部省略
3. If your script depends on a specific backend you can use the function matplotlib.use():
下記 use() 内を 'Agg' に置き換えればいいようです。An Anti-Grain Geometry (AGG) backend
import matplotlib
matplotlib.use('qtagg')
ここから Webアプリケーション(Flask)への埋め込み時の注意が書いてあります。
The builtin backends
# 一部省略
If, however, you want to write graphical user interfaces, or a web application server
(Embedding in a web application server (Flask)), or need a better understanding of what
is going on, read on. To make things easily more customizable for graphical user interfaces
, Matplotlib separates the concept of the renderer (the thing that actually does the
drawing) from the canvas (the place where the drawing goes). The canonical renderer
for user interfaces is Agg which uses the Anti-Grain Geometry C++ library to make
a raster (pixel) image of the figure;
# 一部省略
ただし、グラフィカル ユーザー インターフェイスや Web アプリケーション サーバー (Web アプリケーション
サーバー (Flask) への埋め込み) を作成したい場合、または何が起こっているのかをより深く理解する必要がある
場合は、読み続けてください。 グラフィカル ユーザー インターフェイスのカスタマイズを容易にするために、
Matplotlib はレンダラー (実際に描画を実行するもの) の概念をキャンバス (描画が行われる場所)から分離します。
ユーザー インターフェイスの標準レンダラーは Agg で、アンチグレイン ジオメトリ C++ ライブラリを使用して
図のラスター (ピクセル) イメージを作成します。
1-5. Stackoverflowなどで確認
上記である程度理解ができたのですが確認のため他の人の力を拝借します。
(1) (stackoverflow) UserWarning: Starting a Matplotlib GUI outside of the main thread will likely fail
(回答) 1 模範解答です。ちゃんと根拠 (公式ドキュメント backends) も示しています。
import matplotlib
matplotlib.use('Agg')
(回答) 2 これはひどい。ウォーニングを握りつぶしています。
import warnings
warnings.simplefilter("ignore", UserWarning)
(2) (stackoverflow) How to put Python 3.4 matplotlib in non-interactive mode?
import matplotlib
matplotlib.use('Agg')
(3) 以下のサイトは公式サイト、上記2つのサイトとは異なるアプローチで解決しています。
※この方法はかなり古いバージョンでよく使われていたようです。Qiitaの古い投稿でも見かけました。
(stackoverflow) Python: How to show matplotlib in flask [duplicate]
import io
import random
from flask import Response
from matplotlib.backends.backend_agg import FigureCanvasAgg as FigureCanvas
from matplotlib.figure import Figure

@app.route('/plot.png')
def plot_png():
    fig = create_figure()
    output = io.BytesIO()
    FigureCanvas(fig).print_png(output)
    return Response(output.getvalue(), mimetype='image/png')

def create_figure():
    fig = Figure()
    axis = fig.add_subplot(1, 1, 1)
    xs = range(100)
    ys = [random.randint(1, 50) for x in xs]
    axis.plot(xs, ys)
    return fig
2. 解決策
2-1 (A) 公式ドキュメント、他の参考サイトなどで示された方法
import matplotlib
matplotlib.use('Agg')
2-1 (B) matplotlib.figure.Figure の subplots を呼び出す方法
Matplotlibの公式サイトのドキュメントによると 3.1 以降では Figure を直接作成しメモリ内のバッファーに保存できるなっています。
(Matplotlib) Embedding in a web application server (Flask)
下記コードは上記サイトに掲載されている使用例
import base64
from io import BytesIO

from flask import Flask
from matplotlib.figure import Figure

app = Flask(__name__)


@app.route("/")
def hello():
    # Generate the figure **without using pyplot**.
    fig = Figure()
    ax = fig.subplots()
    ax.plot([1, 2])
    # Save it to a temporary buffer.
    buf = BytesIO()
    fig.savefig(buf, format="png")
    # Embed the result in the html output.
    data = base64.b64encode(buf.getbuffer()).decode("ascii")
    return f"<img src='data:image/png;base64,{data}'/>"
20年以上Javaでオブジェクト指向プログラミング経験してきたので、matplotlib.pyplot の MatLabスタイルがちょっと馴染めません。
matplotlib.figure.Figure を使ったオブジェクト指向スタイルがしっくりきます。
さらにこの記事で想定している python仮想環境のmatplotlibのハージョンが 3.7.4 なので上記公式サイトで示された方法を採用しました。
- Matplitlibで生成した画像データをバイトデータとしてWebアプリ側に返却
- Webアプリ側で バイトデータを base64エンコード文字列に変換しimgタグのソースに設定する
from matplotlib.axes import Axes
from matplotlib.figure import Figure

fig: Figure
ax_press: Axes
ax_pulse: Axes
fig = Figure(figsize=(fig_width_inch, fig_height_inch))
(ax_press, ax_pulse) = fig.subplots(
    2, 1, sharex=True, gridspec_kw={'height_ratios': [7, 3]}
)

# ...途中の実装は省略...

    # 画像をバイトストリームに溜め込みそれをbase64エンコードしてレスポンスとして返す
    buf: BytesIO = BytesIO()
    fig.savefig(buf, format="png", bbox_inches="tight")
    with buf:
        data = buf.getvalue()
    if logger is not None:
        logger.debug(f"data.len: {len(data) if data is not None else 0}")
        logger.debug(f"buf.closed: {buf.closed}")
    # 件数と画像
    return rec_count, data
2-2. 修正後の curl コマンド実行
matplotlibのウォーニングが出力されなくなり画像を含むJSONファイルを保存できました。
$ curl -G -d 'emailAddress=user1%40examples.com&yearMonth=2023-06&userTarget=130%2C85' \
> -H 'X-Request-Phone-Token:__your_make_token_abcdefghijklmnopqrstuvwxz' \
> -H 'X-Request-Image-Size:1020x1700x2.75' \
> http://dell-t7500.local:5000/healthcare/getplot_bloodpress_line_ym_forphone > getplotbpline_month_userTarget.json
  % Total    % Received % Xferd  Average Speed   Time    Time     Time  Current
                                 Dload  Upload   Total   Spent    Left  Speed
100  117k  100  117k    0     0   273k      0 --:--:-- --:--:-- --:--:--  274k
3. matplotlib公式のサンプルで検証する
(1) バッチアプリでmatploclibの画像を生成する例
(Matplotlib) Gallery: Lines,bar and markers > Bar color demo
import matplotlib.pyplot as plt

fig, ax = plt.subplots()

fruits = ['apple', 'blueberry', 'cherry', 'orange']
counts = [40, 100, 30, 55]
bar_labels = ['red', 'blue', '_red', 'orange']
bar_colors = ['tab:red', 'tab:blue', 'tab:red', 'tab:orange']

ax.bar(fruits, counts, label=bar_labels, color=bar_colors)

ax.set_ylabel('fruit supply')
ax.set_title('Fruit supply by kind and color')
ax.legend(title='Fruit color')

plt.show()
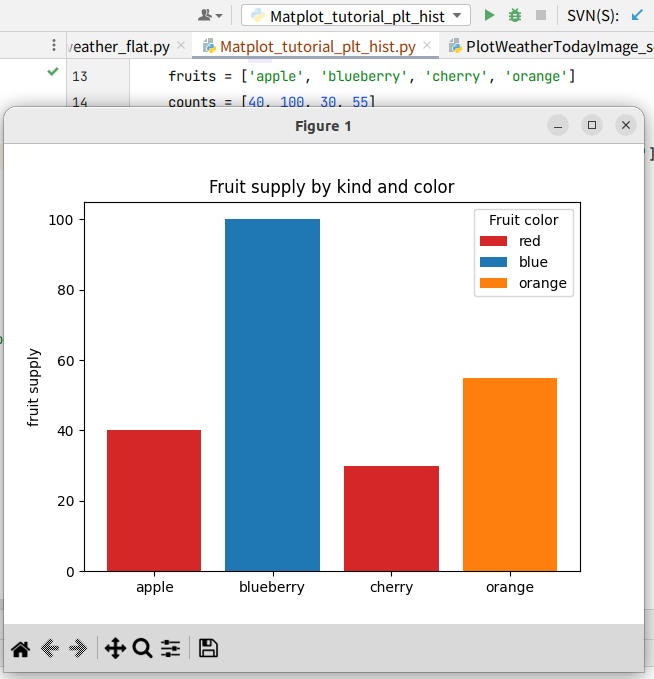
3-1. python バッチで実行
公式サイトサンプルのままですが、次にFlaskで動かすためにプロット処理を関数化しています。
import matplotlib.pyplot as plt

def plot_bar():
    fig, ax = plt.subplots()
    fruits = ['apple', 'blueberry', 'cherry', 'orange']
    counts = [40, 100, 30, 55]
    bar_labels = ['red', 'blue', '_red', 'orange']
    bar_colors = ['tab:red', 'tab:blue', 'tab:red', 'tab:orange']

    ax.bar(fruits, counts, label=bar_labels, color=bar_colors)

    ax.set_ylabel('fruit supply')
    ax.set_title('Fruit supply by kind and color')
    ax.legend(title='Fruit color')
    plt.show()


if __name__ == '__main__':
    plot_bar()
これは実行結果 ※Pycharm IDEから実行
3-2. Flaskアプリ
3-2-1 ソースの構成
Matplotlib_bar_simple/
├── app_main.py
└── templates
    └── show_img.html
3-2-2 (1) HTMLテンプレート
show_img.html
<!DOCTYPE html>
<html lang="ja">
<body>
<h2>Matplotlib example Bar color demo.</h2>
<hr/>
<img src="{{ img_src }}"/>
</body>
</html>
3-2-2 (2) flaskアプリメイン
app_main.py
(1) プロット画像生成処理
- PNG画像(デフオルト)のバイトデータ(bytes)を返却する
import base64
import matplotlib
matplotlib.use('Agg')
import matplotlib.pyplot as plt

from io import BytesIO
from flask import Flask, render_template

def plot_bar():
    fig, ax = plt.subplots()
    fruits = ['apple', 'blueberry', 'cherry', 'orange']
    counts = [40, 100, 30, 55]
    bar_labels = ['red', 'blue', '_red', 'orange']
    bar_colors = ['tab:red', 'tab:blue', 'tab:red', 'tab:orange']

    ax.bar(fruits, counts, label=bar_labels, color=bar_colors)

    ax.set_ylabel('fruit supply')
    ax.set_title('Fruit supply by kind and color')
    ax.legend(title='Fruit color')
    # プロット画像のbytesデータ生成
    buf: BytesIO = BytesIO()
    fig.savefig(buf, bbox_inches="tight")
    with buf:
        data = buf.getvalue()
    return data
(2) メイン処理
- PNG画像のバイトデータをbase64エンコード文字列に変換する
- imgタグのソース用に 先頭に "data:image/png;base64," を付加してテンプレートに渡す
app = Flask(__name__)

@app.route('/')
def index():
    img_data = plot_bar()
    img_base64 = base64.b64encode(img_data).decode("ascii")
    # HTML imgタグのソース文字列
    img_src: str = "data:image/png;base64," + img_base64
    return render_template("show_img.html", img_src=img_src)


# main function
if __name__ == '__main__':
    app.run()
3-2-3 flaskアプリ実行
(1) python 仮想環境からflaskアプリを実行
$ . py_venv/py38_raspi4/bin/activate
(py38_raspi4) $ python app_main.py
 * Serving Flask app 'app_main'
 * Debug mode: off
WARNING: This is a development server. Do not use it in a production deployment. Use a production WSGI server instead.
 * Running on http://127.0.0.1:5000
Press CTRL+C to quit
(2) ブラウザから実行
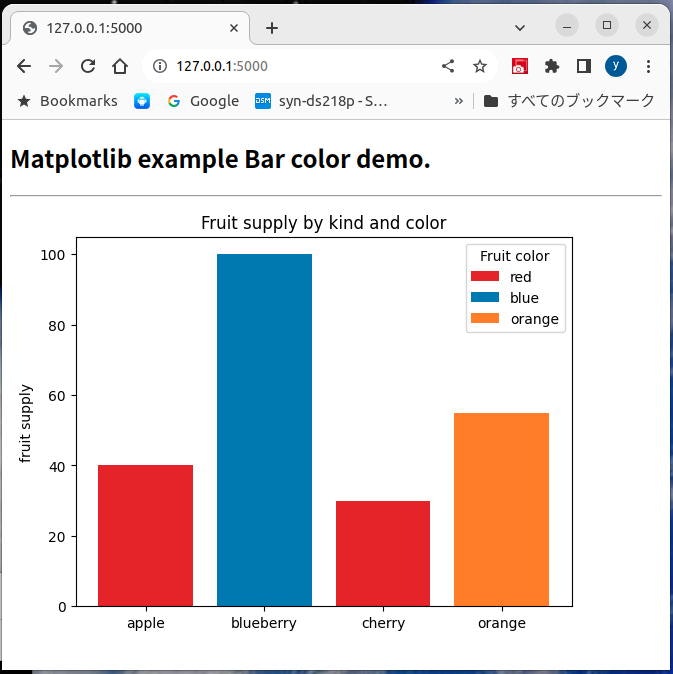
(3) ブラウザから実行後のコンソールログ
ウォーニングもエラーもなく実行できました。
127.0.0.1 - - [25/Nov/2023 16:05:33] "GET / HTTP/1.1" 200 -
127.0.0.1 - - [25/Nov/2023 16:05:33] "GET /favicon.ico HTTP/1.1" 404 -
3-2-4 2-1-(B) のFigureクラスを使ったものに変更
コメント部分が、Figureを使ったものに置き換わっただけとなります。
import base64
# import matplotlib
# matplotlib.use('agg')
# import matplotlib.pyplot as plt
from matplotlib.figure import Figure

from io import BytesIO
from flask import Flask, render_template

def plot_bar():
    # fig, ax = plt.subplots()
    fig = Figure()
    ax = fig.subplots(nrows=1, ncols=1)
    # 以下変わらないので省略
実行結果は 3-2-3 (2) と同じになります。
4. 結論
本当は Pycharm IDE 上で pyplot.show で出力を確認したら、可視化モジュールをFigureに戻すはずが失念したため今回の事態に至りました。
それでもバックエンドに関してはあまりよく理解せずに実装していたのでいい勉強になりました。
2-1(B)の方法で実装したFlaskアプリに関しては下記GitHubリポジトリで公開しております。
GitHub(pipito-yukio) Personal Healthcare applications: personal_healthcare/src/webapp
可視化画像を受け取る側のAndroidアプリの実装に関しては下記GitHubリポジトリで公開しております。
参考までにラズパイ4(本番機)でのアプリログを下記に示します。
※1 プロダクションで動作させています Waitress (WSGIサーバー)
※2 リクエストスレッドが flaskのスレッドではなく waitress のスレッドで動作しているのが確認できます。
※3 リクエストヘッダーのトークンはダミー文字列に編集しています。
2023-08-30 16:29:55,573 INFO [MainThread] __init__.py(53)[<module>] SERVER_HOST: raspi-4.local:12920
2023-08-30 16:29:55,574 INFO [MainThread] __init__.py(64)[<module>] Healthcare database URL: postgresql+psycopg2://developer:***@raspi-4.local:5432/healthcare_db
2023-08-30 16:29:55,682 INFO [MainThread] __init__.py(68)[<module>] Session_healthcare: sessionmaker(class_='Session', bind=Engine(postgresql+psycopg2://developer:***@raspi-4.local:5432/healthcare_db), autoflush=True, expire_on_commit=True)
2023-08-30 16:29:55,682 INFO [MainThread] __init__.py(73)[<module>] Cls_sess_healthcare:
<sqlalchemy.orm.scoping.scoped_session object at 0x7fabc23be0>
2023-08-30 16:29:55,683 INFO [MainThread] __init__.py(78)[<module>] Sensors database URL:
postgresql+psycopg2://developer:***@raspi-4.local:5432/sensors_pgdb
2023-08-30 16:29:55,684 INFO [MainThread] __init__.py(83)[<module>] Cls_sess_sensors:
<sqlalchemy.orm.scoping.scoped_session object at 0x7fabbd51c0>
2023-08-30 16:29:58,004 INFO [MainThread] run.py(15)[<module>] run.py in host: raspi-4.local, port: 12345
2023-08-30 16:29:58,025 INFO [MainThread] run.py(22)[<module>] Production start.

# ここからユーザリクエストスレッド ※スマホは Pixel5 a
2023-08-30 16:31:02,094 DEBUG [waitress-0] app_main.py(247)[getPlotBloodPressLineYearMonthForPhone]
/healthcare/getplot_bloodpress_line_ym_forphone
2023-08-30 16:31:02,095 DEBUG [waitress-0] app_main.py(248)[getPlotBloodPressLineYearMonthForPhone]
{'emailAddress': 'yoshida@yourdomain.com', 'yearMonth': '2023-08'}
2023-08-30 16:31:02,096 DEBUG [waitress-0] app_main.py(753)[_checkRequireCommonForGetImage]
headers: Accept: application/json;
X-Request-Phone-Token: __your_make_token_abcdefghijklmnopqrstuvwxz
X-Request-Network-Type: wifi
X-Request-Image-Size: 1064x1336x2.750000
User-Agent: Dalvik/2.1.0 (Linux; U; Android 13; Pixel 4a Build/TQ3A.230805.001)
Host: raspi-4.local:12345
Connection: Keep-Alive
Accept-Encoding: gzip
※1 初回のみ User-Agentの確認をしたかったのでサービスを止めてDEBUGにし採取しています。
※2 運用中は INFO 以上出力設定にしてるのでウォーニング・エラーがなければ起動時のINFOログ出力のみてす。