Introduction
In Visual Studio, we have Performance Profiler tool that enable us to analyze application interaction-related performance issue in our XAML Universal Window Platform Application. Performance is the critical aspect of any application. It can influence the user's perception of the entire application. The application profiling tool helps us to improve the performance by providing a semantically-rich, scenario centric view of our application's resource consumption. We can analyze the time spent by the application preparing UI frames, servicing network and disk requests, and much more scenarios like application start up and page load.
How to use the tool?
To open the Performance Profiler tool in Visual Studio, click on Analyze from the main menu and select Performance Profiler or simply use the shortcut (ALT + F2), and we can stop the analysis process by clicking on the link in Visual Studio and it will automatically generate the diagnosis report for us.
Now we can check the performance report for optimization.
How to inspect the report?
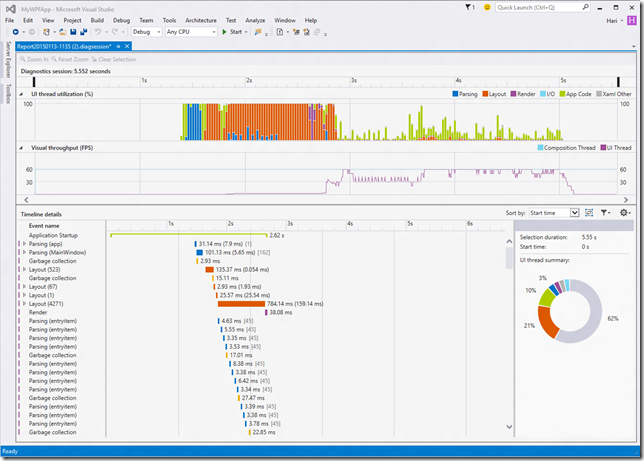
The report lists all events in our application, which correspond to the CPU consumption during our application's execution.
Graphs
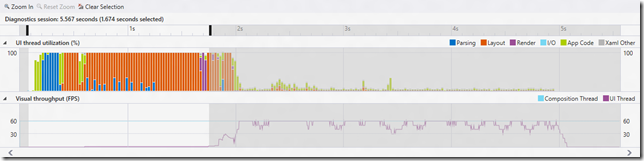
In the top most of the report, it shows the UI thread utilization of the application. It spots out the detail of UI thread utilization and the low frame rate which might correspond to poor application responsiveness.
Details View
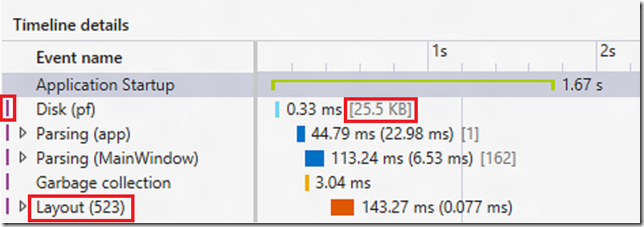
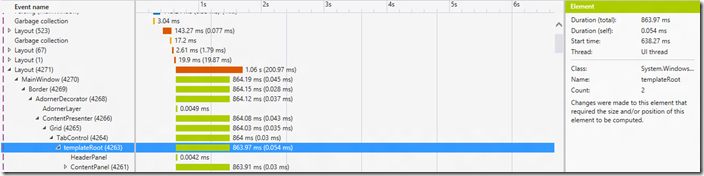
Right in the bottom most of the report is the details view. It shows us the details of CPU utilization of the application.
XAML: Layout, Parsing, Render
System: Disk, Network
Other: Garbage Collection
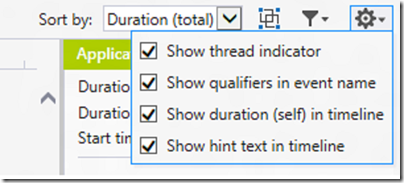
These UI enhancement can be turned off by using View Settings in the command bar of the details view.
Layout: In large applications, often thousands of elements are shown on the screen at the same time. This might result a low UI frame rate that correspond to the poor responsiveness. We can use this visualization to determine which of our logical trees need pruning, to optimize the layout.
Parsing:
It indicates the total amount of time spent by the UI thread in parsing XAML files and creating objects. 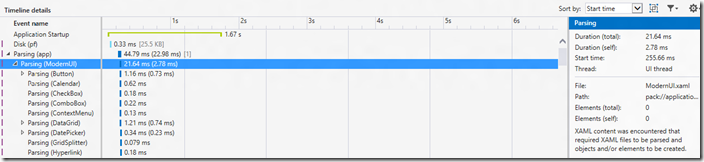 Application startup: It measures the interval between the application launch by the operating system to the time taken for the application to the submit the first frame to the Desktop Window Manager.  So these are all the main stuff about UWP performance review in Visual Studio. Reference: https://blogs.msdn.microsoft.com/wpf/2015/01/16/new-ui-performance-analysis-tool-for-wpf-applications/