- matplotlibで3次元の散布図を描きたいとき用のメモ書き
- コピペして使おう
- コード内のコメント見れば大体わかるはず。たぶん。
import numpy as np #適当な配列作るためにNumpy使う
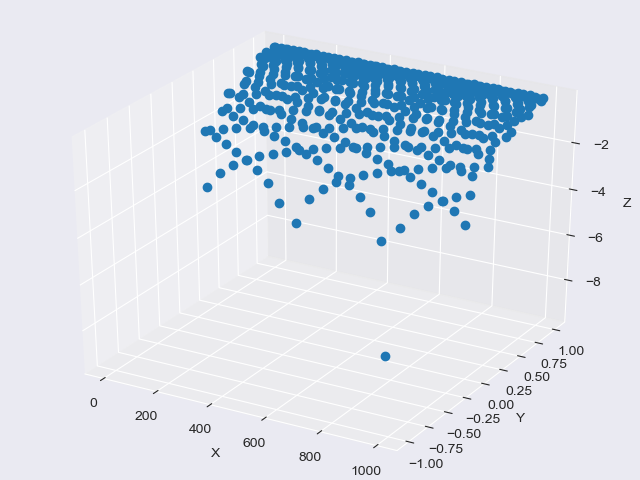
X = np.array([i for i in range(1,1000)]) #自然数の配列
Y = np.sin(X) #特に意味のない正弦
Z = np.log(Y) #特に意味のない自然対数
# 備考:Numpyだとnp.log()は自然対数。常用対数はnp.log10()
import matplotlib.pyplot as plt
# seabornでグラフをきれいにしたいだけのコード
import seaborn as sns
sns.set_style("darkgrid")
# 3次元プロットするためのモジュール
from mpl_toolkits.mplot3d import Axes3D
# グラフの枠を作っていく
fig = plt.figure()
ax = Axes3D(fig)
# 軸にラベルを付けたいときは書く
ax.set_xlabel("X")
ax.set_ylabel("Y")
ax.set_zlabel("Z")
# .plotで描画
# linestyle='None'にしないと初期値では線が引かれるが、3次元の散布図だと大抵ジャマになる
# markerは無難に丸
ax.plot(X,Y,Z,marker="o",linestyle='None')
# 最後に.show()を書いてグラフ表示
plt.show()
参考
https://www.amazon.co.jp/dp/B07NQ5W8DW/ref=dp-kindle-redirect?_encoding=UTF8&btkr=1