月次リターンのカレンダー効果を検証
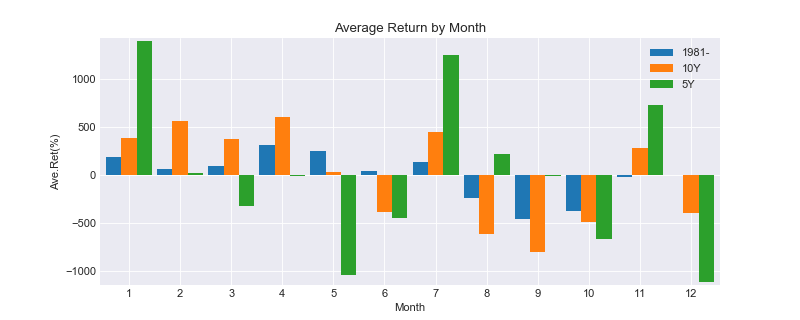
statsmodelsのdecomposeを用いて、ハロウィーン効果、Sell in Mayなど巷で言われるカレンダー効果が見られるか実験
import numpy as np
import pandas as pd

import statsmodels.api as sm
import pandas_datareader.data as web

import warnings
warnings.filterwarnings('ignore')

import matplotlib.pyplot as plt
plt.style.use('seaborn-darkgrid')
plt.rcParams['axes.xmargin'] = 0.01
plt.rcParams['axes.ymargin'] = 0.01

window = 250*3

'''S&P500データ取得 '''
data1 = web.DataReader("^GSPC", "yahoo", "1980/1/1").dropna()

# Treasury Yield 10 Yearsデータ取得
data2 = web.DataReader("^TNX", "yahoo", "1980/1/1").dropna()

# 日々年率Volatility = 10%にレバレッジ調整した設定
ret = pd.DataFrame(data1['Adj Close'] / data1['Adj Close'].shift(1) - 1)
ret = 0.1 * ret / (ret.rolling(252).std()*np.sqrt(252)).shift(1)
data1 = 100*((1 + ret).cumprod()).dropna(axis=0)

data1_freq = data1.resample('M').last().fillna(method='ffill')
data1_freq['ret1'] = data1_freq['Adj Close']/data1_freq['Adj Close'].shift(1) - 1

# 月次ターンを再作成
data1_freq_equity_curve = 100*((1 + data1_freq['ret1']).cumprod()).dropna(axis=0)
data1_freq_equity_curve.index = pd.to_datetime(data1_freq_equity_curve.index)

# 通期、10年(120ヵ月)、5年(60ヵ月)
res_all = sm.tsa.seasonal_decompose(data1_freq_equity_curve, freq=12)
res_10Y = sm.tsa.seasonal_decompose(data1_freq_equity_curve[-120:], freq=12)
res_5Y = sm.tsa.seasonal_decompose(data1_freq_equity_curve[-60:], freq=12)

seasonality = pd.concat([res_all.seasonal,
                         res_10Y.seasonal,
                         res_5Y.seasonal], axis=1)

seasonality.columns = ['1981-', '10Y', '5Y']
m_seasonality = seasonality.groupby(seasonality.index.month).mean()

# Creat Figure
month = m_seasonality.index
height = m_seasonality * 100

bar_width = 0.3

plt.figure(figsize=(10, 4), dpi=80)
plt.bar(month, height['1981-'], tick_label=month,
        width=0.3, label='1981-')
plt.bar(month + bar_width, height['10Y'], tick_label=month,
        width=0.3, label='10Y')
plt.bar(month + 2*bar_width, height['5Y'], tick_label=month,
        width=0.3, label='5Y')
plt.xticks(month + bar_width, month)
plt.legend()
plt.title("Average Return by Month")
plt.xlabel("Month")
plt.ylabel("Ave.Ret(%)")
plt.show()
seasonalにリターンを見ると
- Sell in Mayは近年言えてそう
- 年末売り/年初買い?
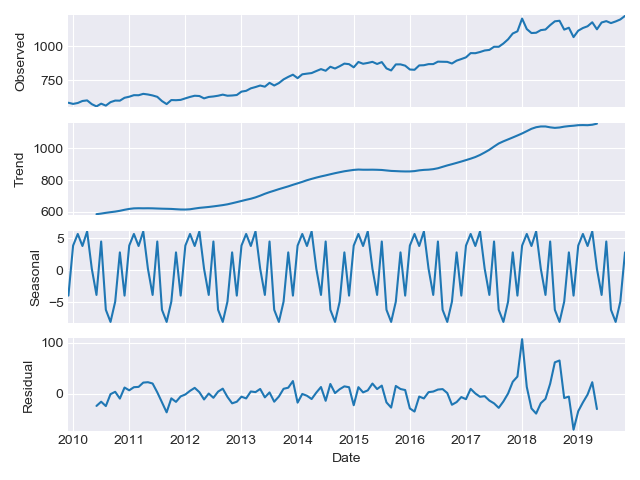
Decomposition(Trend, Seasonality, Residual)
res_10Y.plot()
plt.show()
- 短期的な平均回帰や、マーケット動向を把握するのに使用
- 過去のマーケット環境(Volatility水準の差etc.)の調整が工夫入りそう

