分位点回帰
分位点回帰に触れる機会がありましたので、頭、コードの整理もかねてメモ
分位点回帰とは
分位点回帰は、パーセンタイルq を基準として回帰直線を引く(回帰分析を行う)というもので、パーセンタイルqでの予測に有用。説明変数の大小に残差の分散が依存したデータや、残差が正規分布に従っていない場合に、q毎にデータの関係性を把握することが可能。
- ↓ROGER KOENKERさんQUANTILE REGRESSIONのペーパーの冒頭を引用
Quantile regression is a statistical technique intended to estimate, and conduct inference about, conditional quantile functions. Just as classical linear regression methods based on minimizing sums of squared residuals enable one to estimate models for conditional mean functions, quantile regression methods oer a mechanism for estimating models for the conditional median function, and the full range of other conditional quantile functions. By supplementing the estimation of conditional mean functions with techniques for estimating an entire family of conditional quantile functions, quantile regression is capable of providing a more complete statistical analysis of the stochastic relationships among random variables.
OLSとの違い
- OLS:残差の分布に正規分布を仮定し、二乗誤差の最小化
- 分位点回帰(Quintile Regression):q-パーセンタイルを中心として、非対称絶対値関数の最小化
- 非対称絶対値関数: $f(x) $
f(x) = \left\{
\begin{array}{ll}
r\tau & (r \geq 0) \\
r(\tau - 1) & (r \lt 0)
\end{array}
\right.
実データでの例
- 説明変数:S&P500リターン
- 非説明変数:S&P500のラグ1リターン、金利変化
import numpy as np
import pandas as pd

import statsmodels.api as sm
import statsmodels.formula.api as smf
import pandas_datareader.data as web
import statsmodels.api as sm
from statsmodels.regression.quantile_regression import QuantReg
import warnings
warnings.filterwarnings('ignore')

import matplotlib.pyplot as plt
plt.style.use('seaborn-darkgrid')
plt.rcParams['axes.xmargin'] = 0.01
plt.rcParams['axes.ymargin'] = 0.01


def fit_model(q, explain_variable):
    '''Quintile Regression on q-%tile
    modにQuintile Regressionを設定し、指定した分位(q)毎にQuintile Regression
    '''

    res = mod.fit(q=q)
    out = list(res.params)
    out.insert(0, np.round(q, 2))
    return out

'''S&P500データ取得 '''
data1 = web.DataReader("^GSPC", "yahoo", "1980/1/1").dropna()

'''Treasury Yield 10 Yearsデータ取得'''
data2 = web.DataReader("^TNX", "yahoo", "1980/1/1").dropna()

# 日々年率Volatility = 10%にレバレッジ調整した設定
ret = pd.DataFrame(data1['Adj Close'] / data1['Adj Close'].shift(1) - 1)
ret = 0.1 * ret / (ret.rolling(252).std()*np.sqrt(252)).shift(1)


# S&P500:週次リターン
# TY:週次変化のZ-Score

# 週次ベースに変更
data1 = pd.DataFrame()
data1 = 100*((1 + ret).cumprod()).dropna(axis=0)

data1_freq = data1.resample('W').last()
data1_freq['ret1'] = \
    data1_freq['Adj Close']/data1_freq['Adj Close'].shift(1) - 1

data2_freq = data2.resample('W').last()
data2_freq['diff2'] = data2_freq['Adj Close'] - \
                      data2_freq['Adj Close'].shift(1)

# Z-Scoreへ変換
data2_freq['z_diff2'] = (data2_freq['diff2'] -
                         data2_freq['diff2'].rolling(50).mean()) / \
                         data2_freq['diff2'].rolling(50).std()
#  データ結合
df_base = pd.concat([data1_freq['ret1'],
                     data1_freq['ret1'].shift(1), data2_freq['z_diff2']],
                    axis=1).dropna(axis=0)

#  回帰分析(分位点回帰&OLS)
df_base.columns = ['ret', 'X1', 'X2']

Y = 'ret'  # 非説明変数
X = ['X1', 'X2']  # 説明変数(前週のリターン、TY:米国長期金利(10年)週次変化のZ-Score)
mod = QuantReg(df_base[Y], sm.add_constant(df_base[X]))

q_list = np.arange(.05, 1.00, 0.05)
models = [fit_model(x, X) for x in q_list]
models_summary = pd.DataFrame(models, columns=['q', 'const', 'X1', 'X2'])

ols = sm.OLS(df_base[Y],
             sm.add_constant(df_base[X])).fit()
out_ols = ols.params

#  まとめDataFrame作成
out_summary = pd.concat([models_summary,
                         pd.DataFrame(out_ols).T], axis=0).fillna('OLS')
out_summary.index = out_summary['q']
out_summary = out_summary.drop('q', axis=1)
out_summary = out_summary.ix[:, ['const', 'X1', 'X2']]
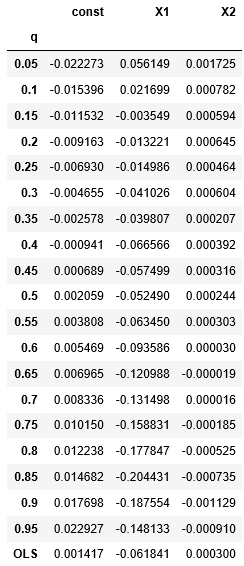
アウトプット
表の最終行のOLSの結果と、各パーセンタイルでの結果での差異が今回見たかったもの

- 週次リターンを見ると、ほとんどのパーセンタイル&OLSで一週間ずらしのリターンとの係数は負だが、大きく下がったとき(q=0.05, 0.1)では正。係数がマイナスだから、逆張りが有効だと思って、逆張りすると、想定外に大きくやられ得る。
- 金利との関係も、パーセンタイルに依存
メモ
- 分位点回帰推定量の漸近特性の推定を行う話も色々あるよう
- 考え方違うなどありましたらご教授を