xdebug php.iniの設定例。
; 以下の設定だと、IntelliJのRUNではxdebug.modeの設定が無しで実行されるのでmode=developとして実行され、
; DEBUGではIntelliJ側でxdebug.mode=debugが設定されて実行されるのでブレークポイントが働くようになります
xdebug.mode=develop

xdebug.start_with_request=yes
xdebug.client_host=host.docker.internal
xdebug.client_port=9003
xdebug.log=/var/log/php/xdebug.log
上記はPHP8 xdebug3の設定です。
※PHP7xdebug2だと設定キーと値が異なります
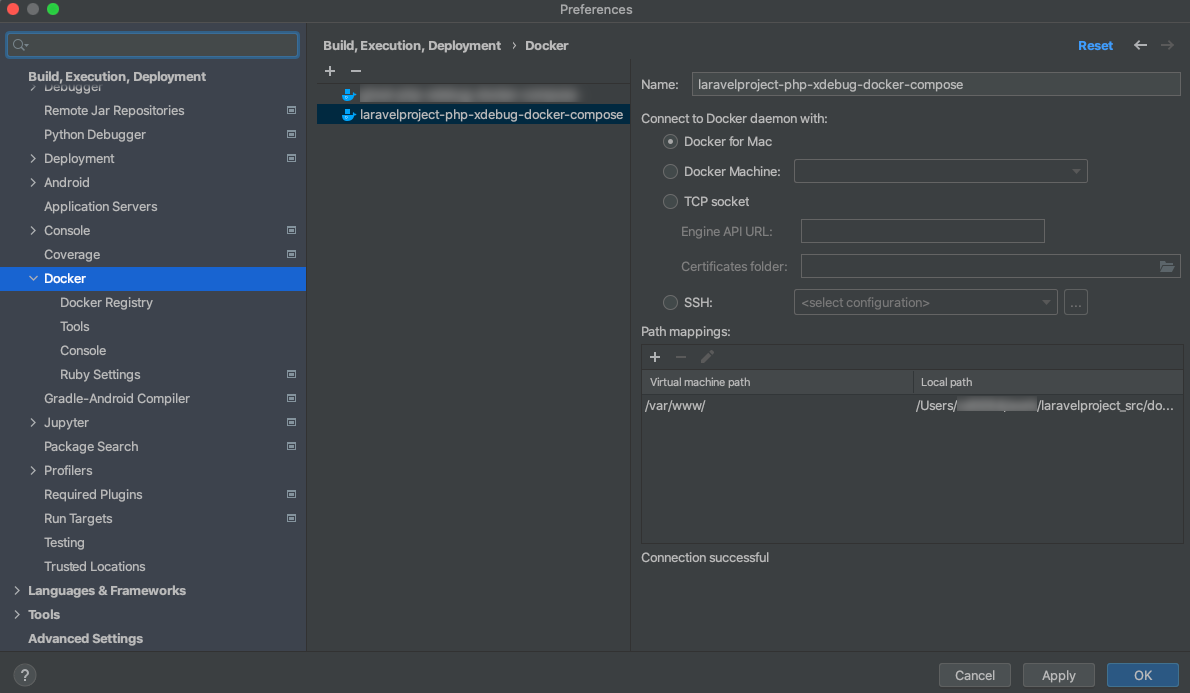
Dockerの設定追加
Virtual machine pathとLocal Pathの対応が一致するように、Path mappingsも設定しましょう。例えばDockerの/var/www/abc.phpが、ホストの/Users/xxx/src/abc.phpと一致させるような設定です。
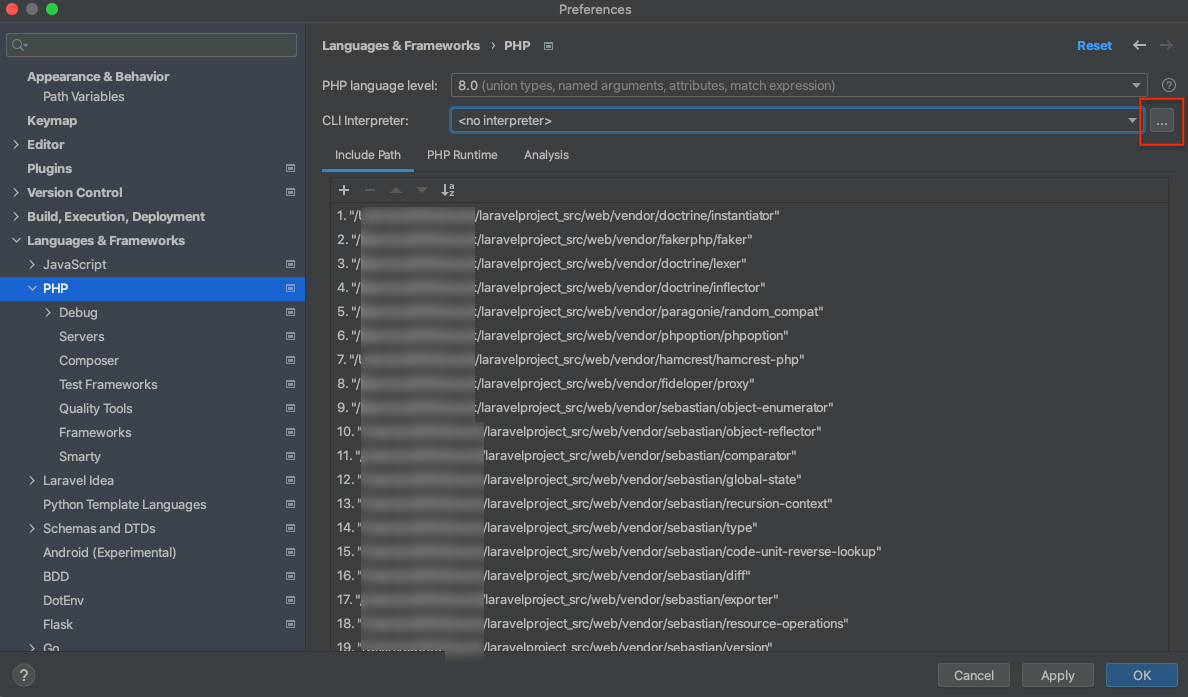
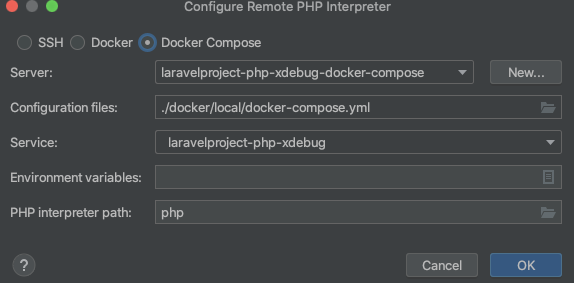
PHP CLI Interpreterの設定追加
PHP Remote Interpreterのプラグインが必要です。「...」をクリック。
Serverは先ほど追加したDockerを指定。今回はDocker Composeを使っているので、Configuration filesでdocker-compose.ymlを指定。ServiceにはPHPが動作するサービスを指定します。
Runを実行してみる
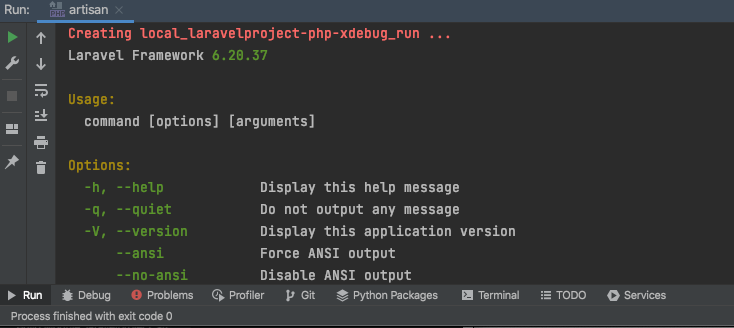
試しにLaravelのartisanを実行。
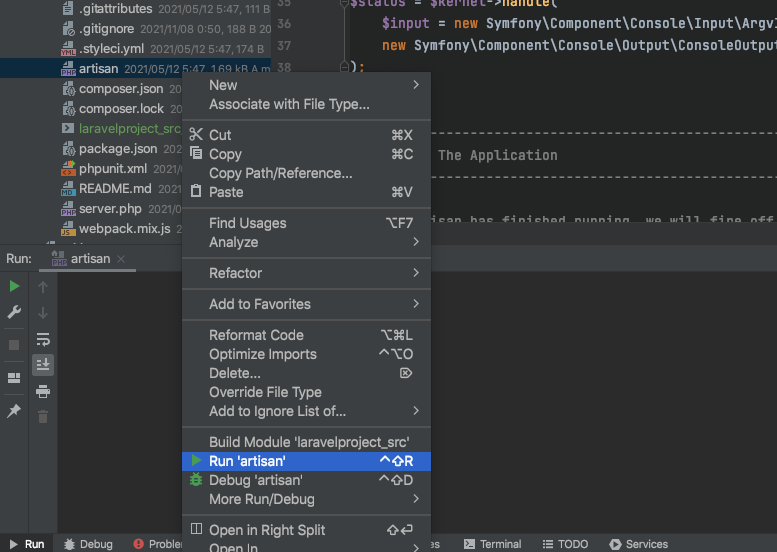
artisanの標準出力を確認できればRemote Interpreterの設定は問題ないです。DockerのPHPで実行できてます。
ブレークポイントを設定して、Debugを実行しても止まらない
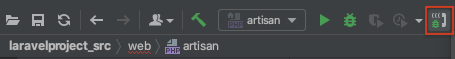
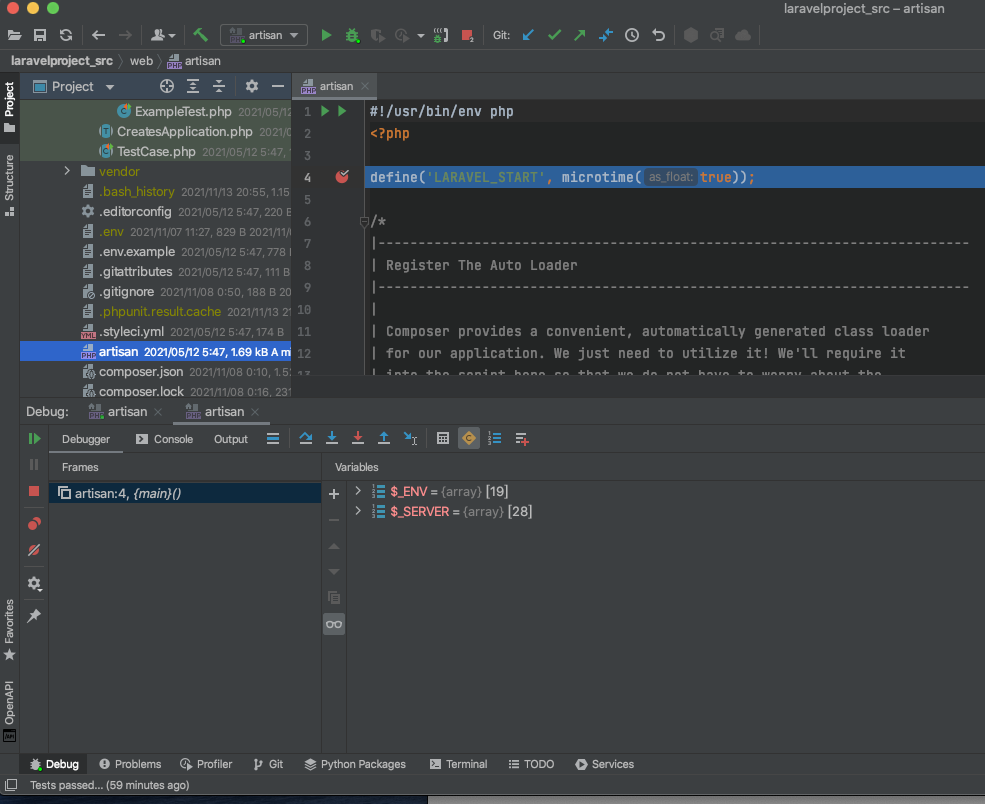
Start Listening for PHP Debug ConnectionsでListening状態にします。緑色になっていればOK。
artisanの最初の行でブレークポイントを設定して、Debugを実行してみます。
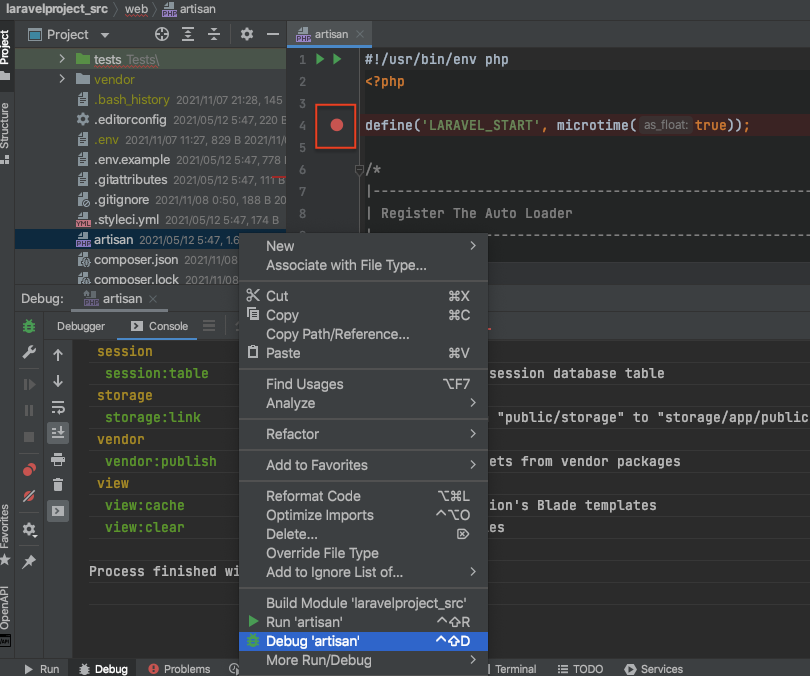
しかし、ブレークポイントで停止せず、以下のエラーが表示されました。
Connection was not established.
Probably 'xdebug.remote_host=host.docker.internal' is incorrect. Change 'xdebug.remote_host'
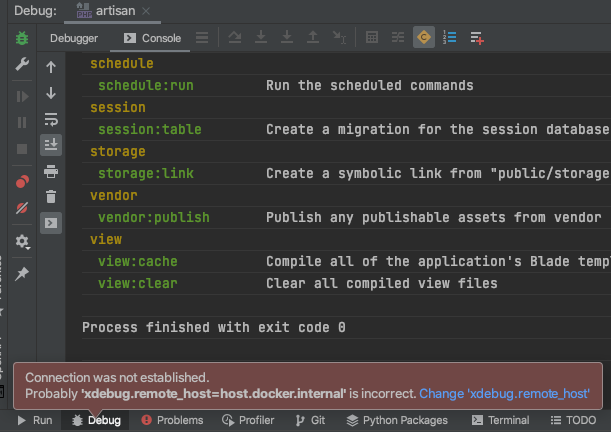
IntelliJ IDEA側の実行ログを見ても-dxdebug.client_host=host.docker.internalがあるのですが、incorrectと表示されます。
エラーを回避するため、設定を加えます。
デバッグ実行できるよう設定を追加
php実行側の接続先の名称と、IntelliJ IDEA / PhpStormの名称を揃えて、一致させるような設定です。
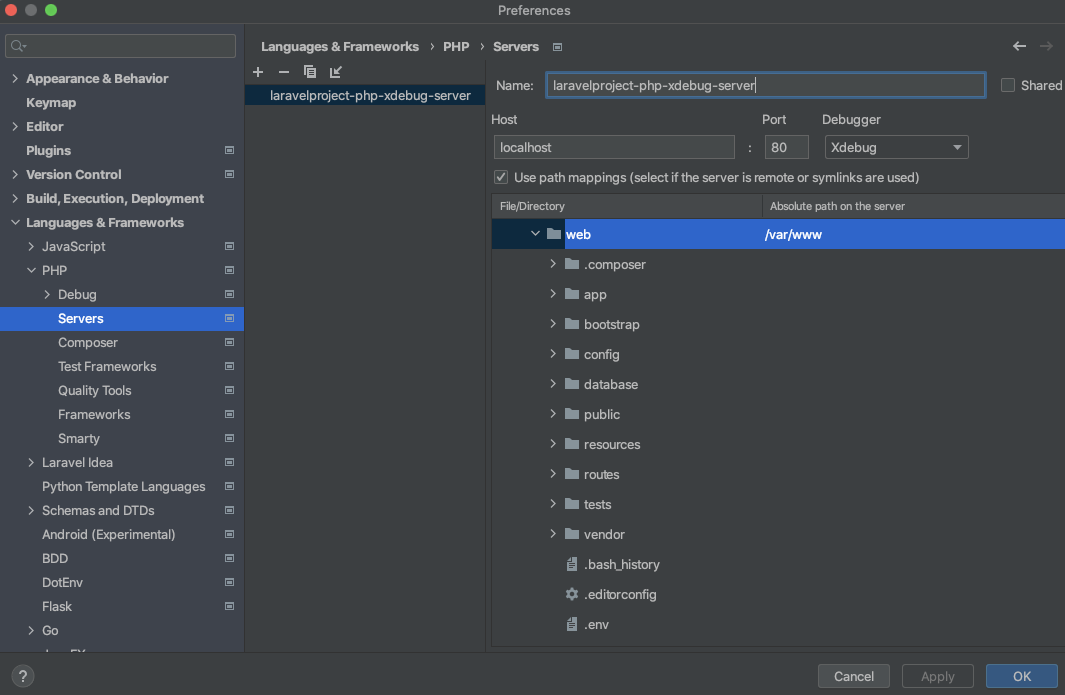
名称を「laravelproject-php-xdebug-server」とします。
環境変数PHP_IDE_CONFIGの設定
docker composerの設定例です。
version: "3"
services:
  laravelproject-php-xdebug:
    environment:
      PHP_IDE_CONFIG: "serverName=laravelproject-php-xdebug-server"
IntelliJ IDEA / PhpStormのPHP Serversの設定
Serversに「laravelproject-php-xdebug-server」を追加。path mappingsも設定します。
PHP CLI InterpreterにConfiguration Optionsを追加
以下設定を加えておかないと接続が不安定なので追加します。
-dxdebug.client_port=9003 -dxdebug.client_host=host.docker.internal
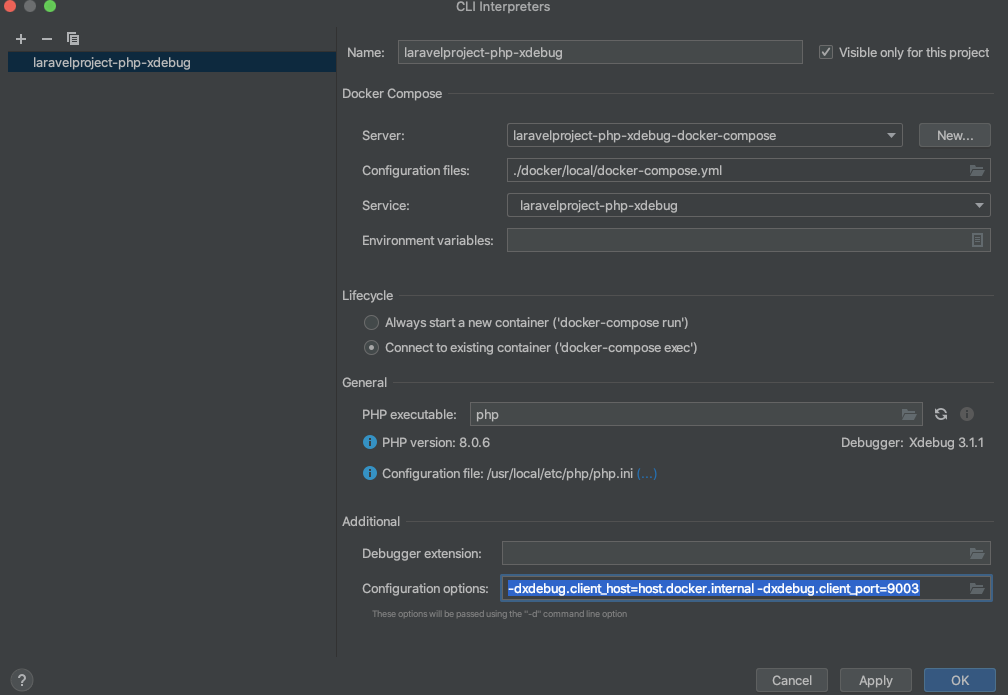
DEBUG実行時に、xdebug.client_portは9000で勝手にセットされるみたいで9003を別途設定しています。xdebug.client_hostもhost.docker.internalで自動セットされるので不要っぽく見えるのですが、なぜか無いと接続できない時があってその原因がわかってないので、とりあえず追加しています。
改めて、ブレークポイントを設定して、Debugを実行
無事、停止されました。
dockerのbashからデバッグ実行する
dockerのシェルからデバッグを開始したい場合。
# -dxdebug.mode=debugを追加してphpを実行
$ PHP_IDE_CONFIG=serverName=laravelproject-php-xdebug-server php -dxdebug.mode=debug artisan
# または、以下だけでも動作する
$ php -dxdebug.mode=debug artisan
# 別方法
$ XDEBUG_MODE=debug XDEBUG_SESSION=session_name php artisan
php.iniでxdebug.mode=developにしているため、debugを指定しました。
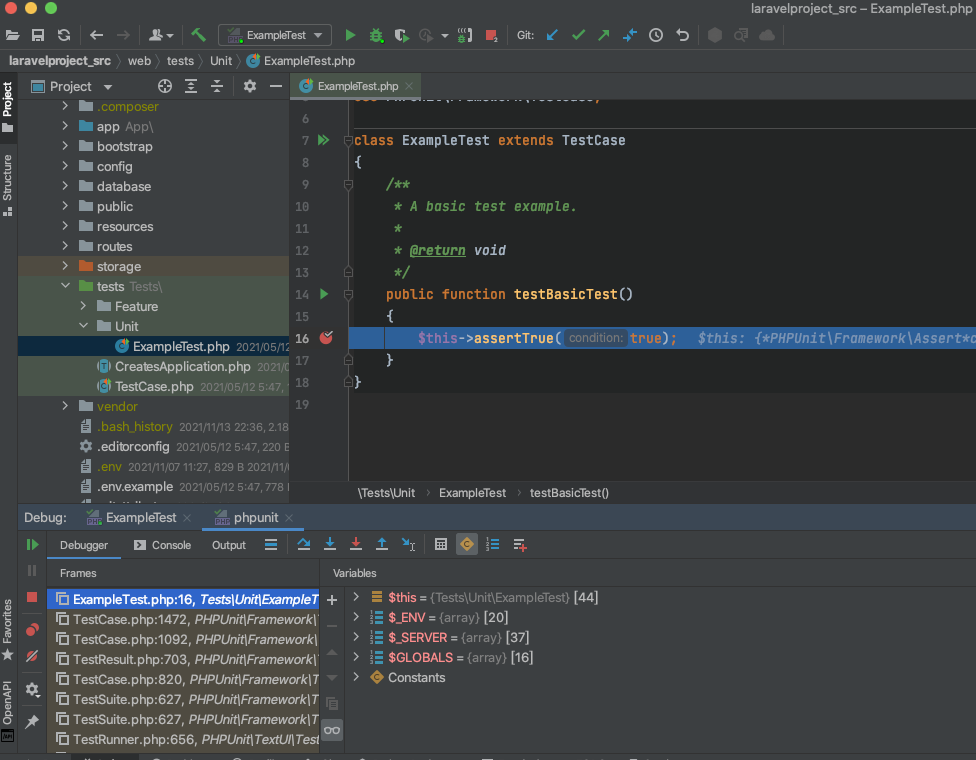
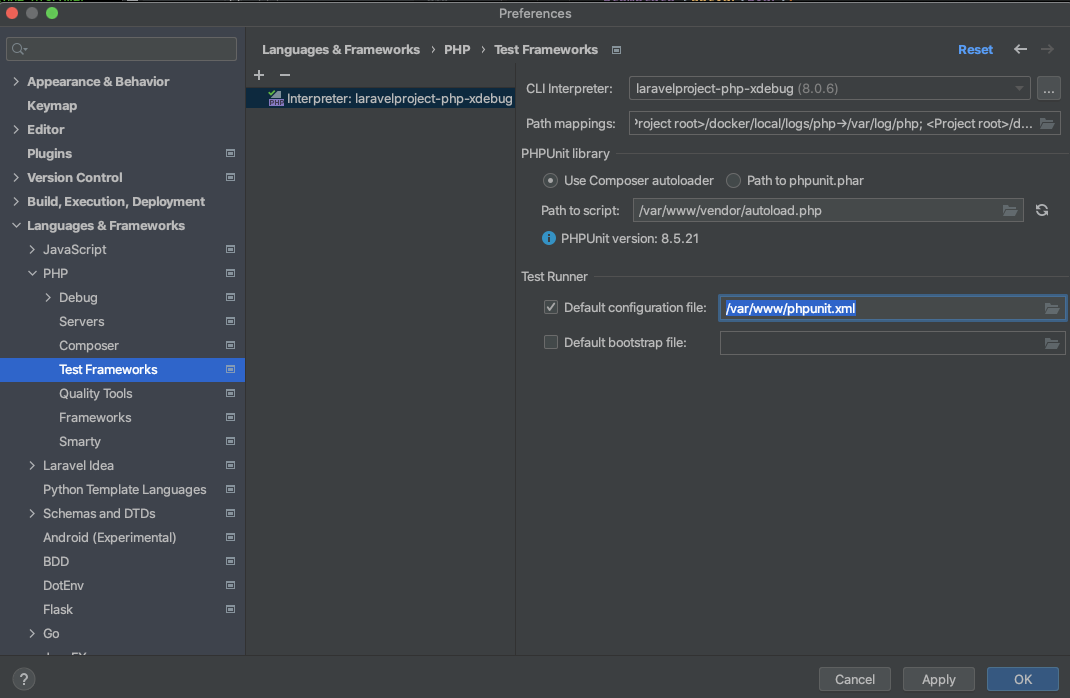
IntelliJ IDEA / PhpStormからPHPUnitをデバッグ実行する
Test Frameworksを追加します。Test RunnerのDefault configuration fileは、virtual側のパスでphpunit.xmlを指定します。
PHPUnitのTestファイル開いて、「>>」の「Debug〜」からDEBUGを実行します。
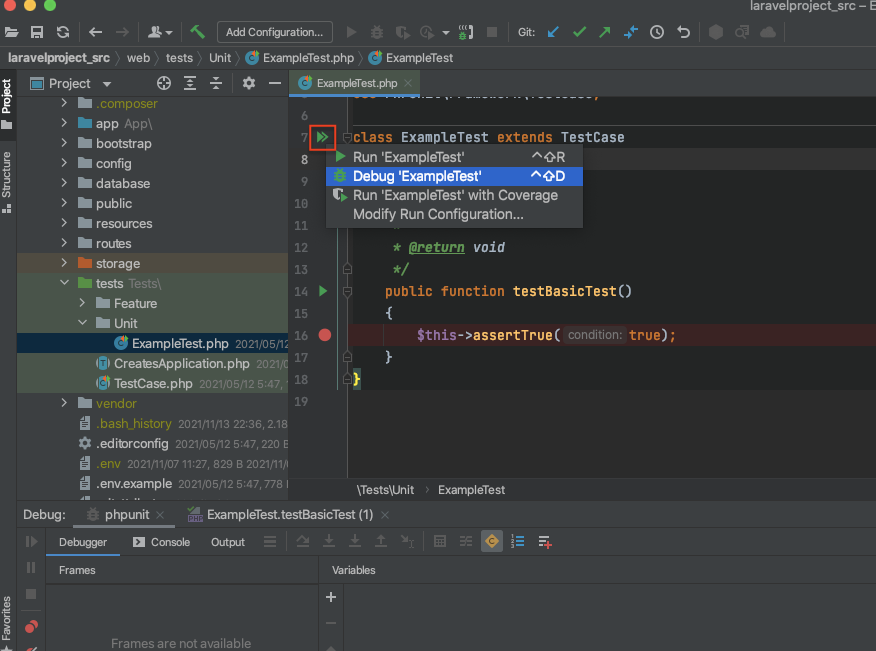
ブレークポイントも動作しています。