背景
SQL Serverにおけるクエリパフォーマンス関連のメトリックには「SQLServer:Batch Resp Statistics」があります。
これは、クエリベースでは以下のようなクエリで取得できます。
select *
from sys.dm_os_performance_counters with(nolock)
where object_name like '%batch resp%'
and instance_name like '%Elapsed Time:Requests%'
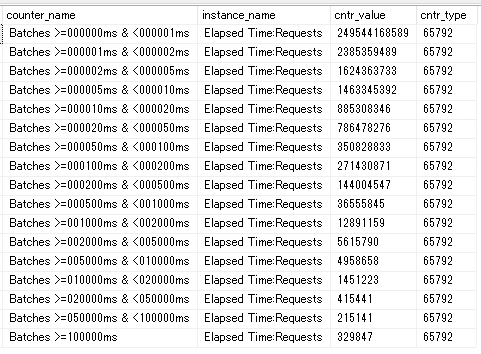
この結果は累計値のため、サーバーが起動してから今までの間に、0-1msec未満のバッチが累計で249544168589回実行された、ということが分かります。そのままだとあまり価値のない情報ですが、2点間の差分をとることで、例えば1分間に0-1msecのバッチが10回、1-2msecのバッチが3回実行された、といった事実が分かります。
この情報でも有用なのですが、DBのレイテンシの傾向として、90パーセンタイル値、95パーセンタイル値、99パーセンタイル値を取得してグラフ化できるとより有益な情報になるのではと考えました。
完全に正確な値を取得する方法は思いつきませんでしたが、近似値であれば取得する方法を考えたので、本記事でクエリを共有したいと思います。
クエリは以下の通りです。5秒間におけるサーバーの90パーセンタイル値、95パーセンタイル値、99パーセンタイル値の近似値を取得することができます。
select getdate() as sampled_at, *
into #stat
from sys.dm_os_performance_counters with(nolock)
where object_name like '%batch resp%'
and instance_name like '%Elapsed Time:Requests%'

waitfor delay '00:00:05'

insert into #stat
select getdate() as sampled_at, *
from sys.dm_os_performance_counters with(nolock)
where object_name like '%batch resp%'
and instance_name like '%Elapsed Time:Requests%'

select
*
into #stat2
from
(
	select
	*
	,cntr_value - LAG(cntr_value, 1, cntr_value) OVER(partition by counter_name order by sampled_at) as lag_value
	,row_number() over(partition by counter_name order by sampled_at desc) as rownum
	from #stat
) as a
where rownum = 1
order by sampled_at

select
*
,accmulated_lag_value*100. / sum_lag_value as accumlated_perentage
into
# stat3
from
(
select
*
,sum(lag_value) over(order by counter_name) as accmulated_lag_value
,sum(lag_value) over() as sum_lag_value
from
# stat2
) as a
order by counter_name

select
min(case when rownum_90 = 1 then counter_name else 'ZZZ' end) as percentile_90
,min(case when rownum_95 = 1 then counter_name else 'ZZZ' end) as percentile_95
,min(case when rownum_99 = 1 then counter_name else 'ZZZ' end) as percentile_99
from
(
select
row_number() over (order by case when accumlated_perentage >= 90 then accumlated_perentage else 99999 end) as rownum_90
,row_number() over (order by case when accumlated_perentage >= 95 then accumlated_perentage else 99999 end) as rownum_95
,row_number() over (order by case when accumlated_perentage >= 99 then accumlated_perentage else 99999 end) as rownum_99
,*
from #stat3
) as a
結果は、例えば以下のようになります。

結果のように、「90パーセンタイル値は5msec-10msecである」といった少し曖昧さの残る値しか分かりません。
また、正確に90パーセンタイル値や95パーセンタイル値を表現できるわけではなく、「90パーセントを超える値の中で最小のもの」という条件になるので、こちらも曖昧さの残る数値となります。
したがって、完全に正確なパーセンタイル値を表現できるわけではありませんが、普段からダッシュボード化しておくことでDB全体のレイテンシの傾向の変化には気づきやすくなるかと思います。