概要
下記の論文を簡単に読んだので備忘録を兼ねてまとめる
Density-Based Clustering Based on Hierarchical Density Estimates
WHO : Ricardo J.G.B. Campello⋆, Davoud Moulavi, and Joerg Sander⋆⋆
WHEN : 2013年
WHERE : --
WHAT : 今回の手法の提案
WHY : 実世界データは異なる密度閾値でクラスタが生成されている
HOW : 階層的クラスタリング + 密度ベース
目次
- どんなクラスタリング結果になるか(サンプル)
- HDBSCANのモチベーション
- アルゴリズム
- 階層的クラスタリング
- 樹形図圧縮
- クラスタ抽出
- Pythonで実行
- pip install
- import
- 実行
どんなクラスタリング結果になるか(サンプル)
入力データセット(https://github.com/scikit-learn-contrib/hdbscan/blob/master/notebooks/clusterable_data.npy)

出力結果

灰色のデータはどのクラスタにも所属しない。
同色のデータは同じクラスタに所属している。
上記の場合は、「水色、黄色、赤、紫、緑、青」の6種類のクラスタおよびどのクラスタにも所属しない「灰色」で構成されている。
HDBSCANのモチベーション
幾つかの密度ベースクラスタリングは、
- 単一密度閾値でクラスタを生成している
- 密度が異なる時、最上位クラスタを得られない
- データに対してフラットラベリングのみ提供(要するに非階層的クラスタリング)
- 複数のハイパーパラメータを必要とする
HDBSCANは、
- 異なる密度閾値でクラスタを生成している
- 密度が異なる時も、最上位クラスタを得られる。
- データに対して、フラットパーティションを提供(要するに階層的クラスタリング)
- ハイパーパラメータは1つ
アルゴリズム
自分なりに、STEPを区切ってみたところ、
以下の3ステップで構成されている。
-
階層的クラスタリング
- 最小距離法
- 樹形図出力
-
樹形図の圧縮
- ハイパーパラメータを用いた圧縮
-
クラスタ抽出
- 評価指標 S (Stability)を定義
- Sを用いた目的関数の最適化
1. 階層的クラスタリング
クラスタリングの中でも、伝統的な階層的クラスタリングを用いている。
論文では、階層的クラスタリングの手法の一つである最小距離法を採用しているが、他の手法でも可能なのかはわからない。
最小全域木を求めるアルゴリズムが様々提案されていたり、数学的解釈を考えているのかも?(論文ではPrim'S Algorithmを採用)
1-1 最小距離法
階層的クラスタリングの中でもメジャーな手法の一つ、sklearnにもある。
アルゴリズムに関しては、検索すれば優秀な解説が色々ヒットするので省略します。
距離は、密度を考慮したものを新しく定義
下図に例を示す。(引用元:https://hdbscan.readthedocs.io/en/latest/how_hdbscan_works.html)
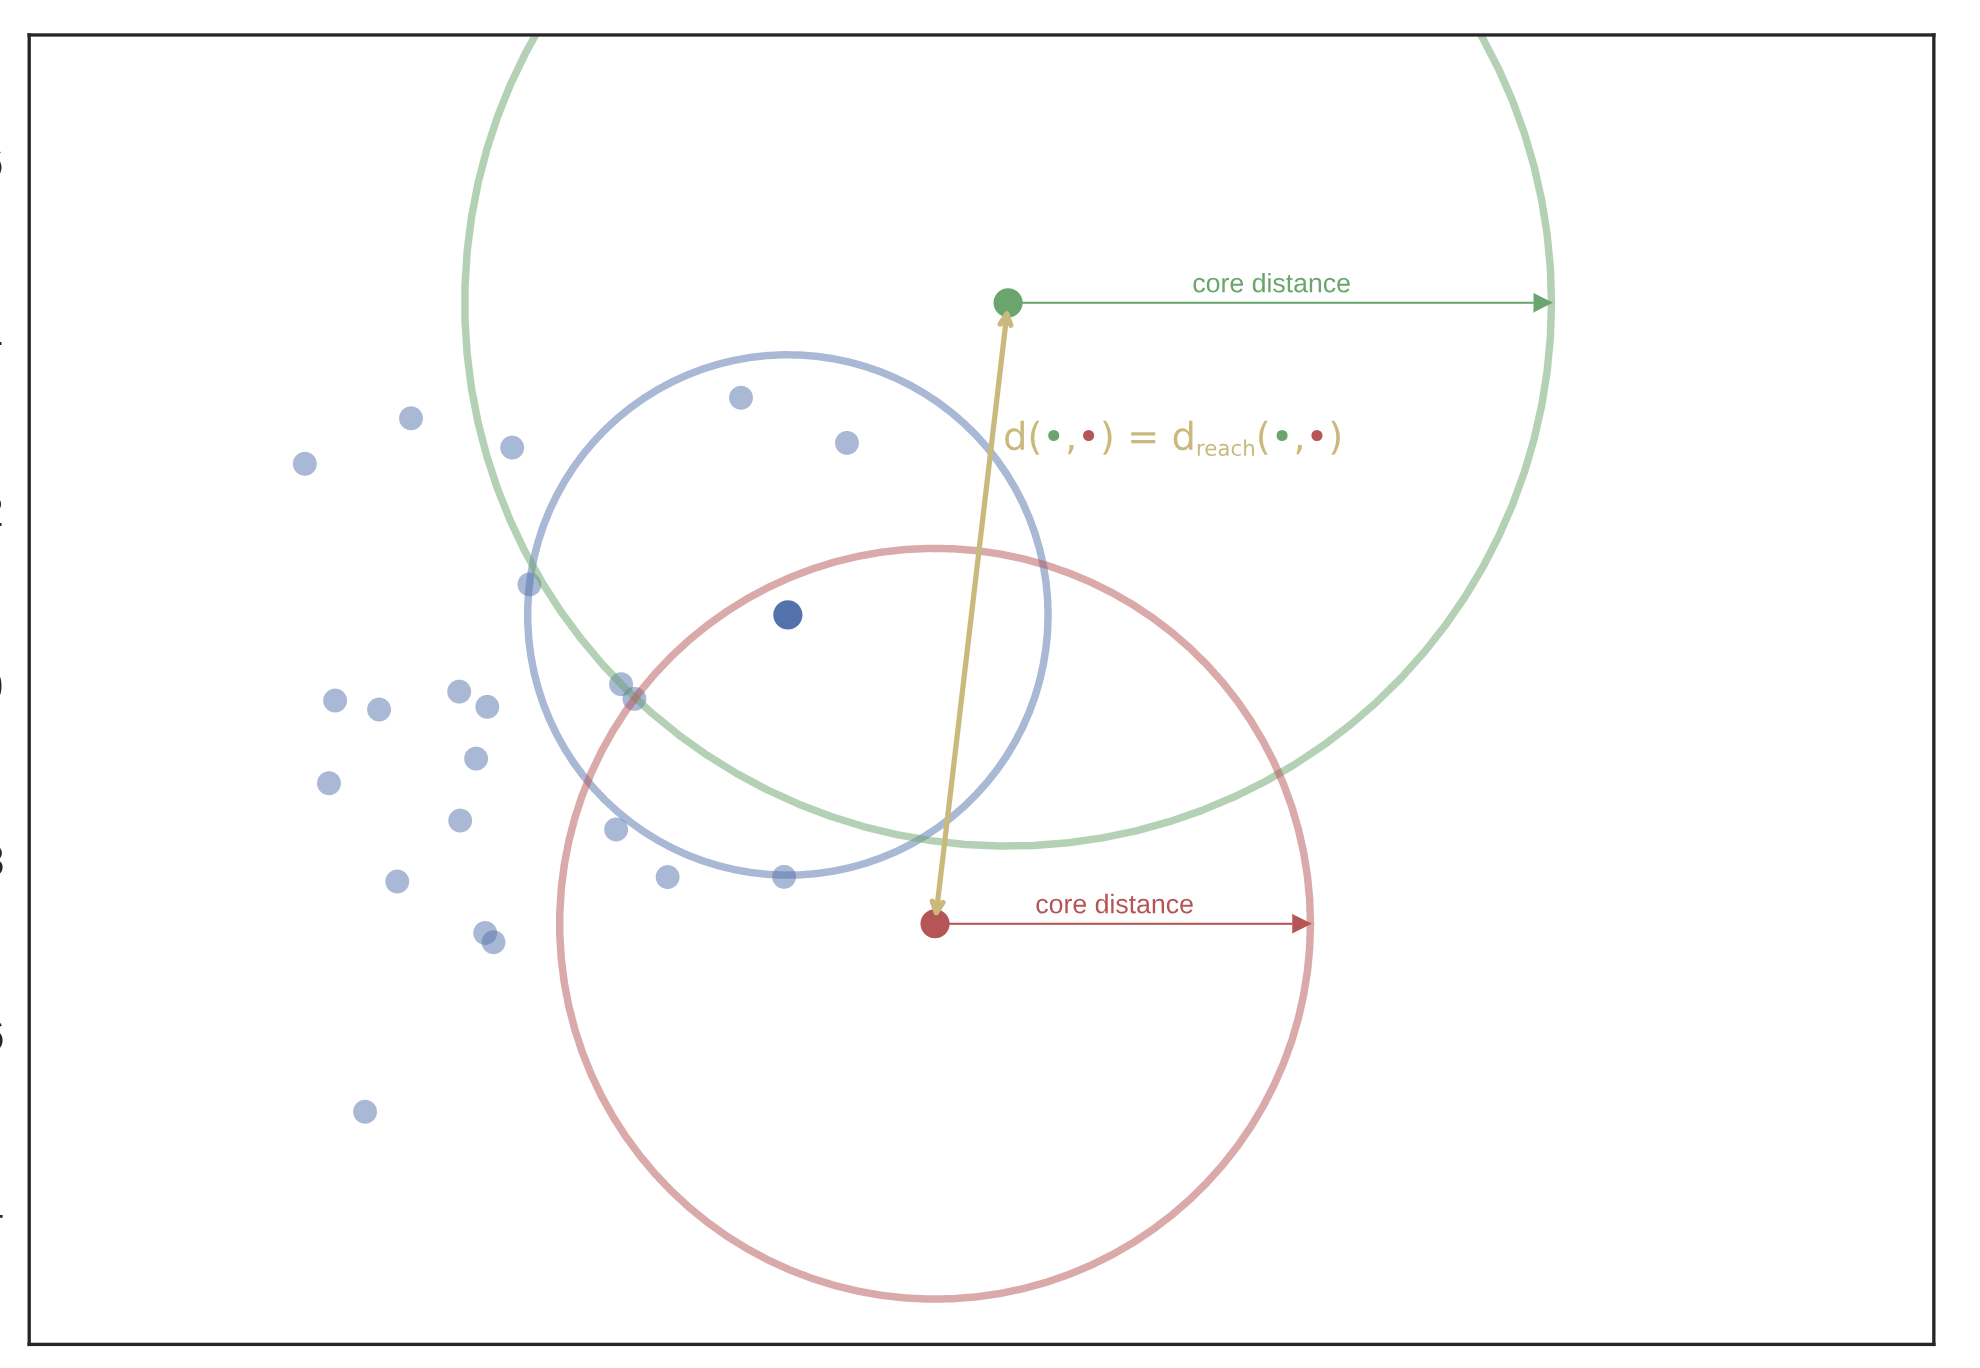
$d_{mreach-d(a,b)} = \max\{core_k(a),core_k(b),d(a,b)\}$
2点間の距離を上記の式で定義、$d(x,y)$は、ユークリッド距離の2乗とか
$d_{mreach-d(緑丸,赤丸)}$は、core distanceより遠いので、$d(緑丸,赤丸)$
$d_{mreach-d(緑丸,青丸)}$は、$core_k(青丸) < d,(緑丸,青丸)$ , $d,(緑丸,青丸) , < core_k(緑丸)$なので$core_k(緑丸)$
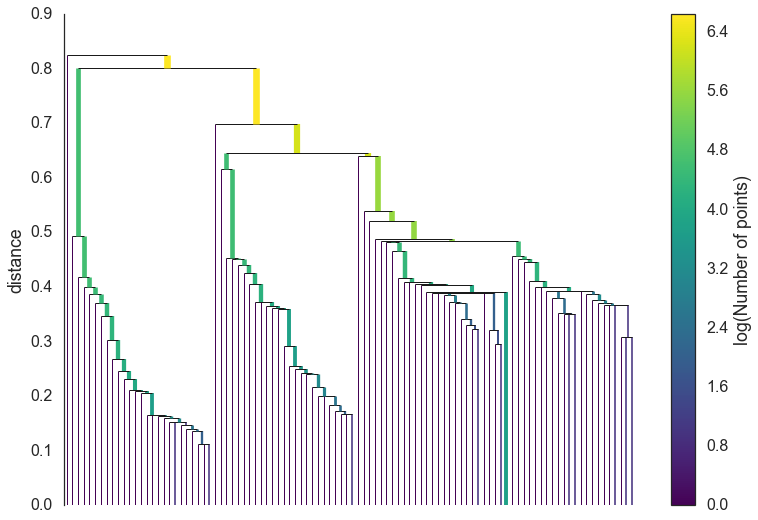
1-2 樹形図出力
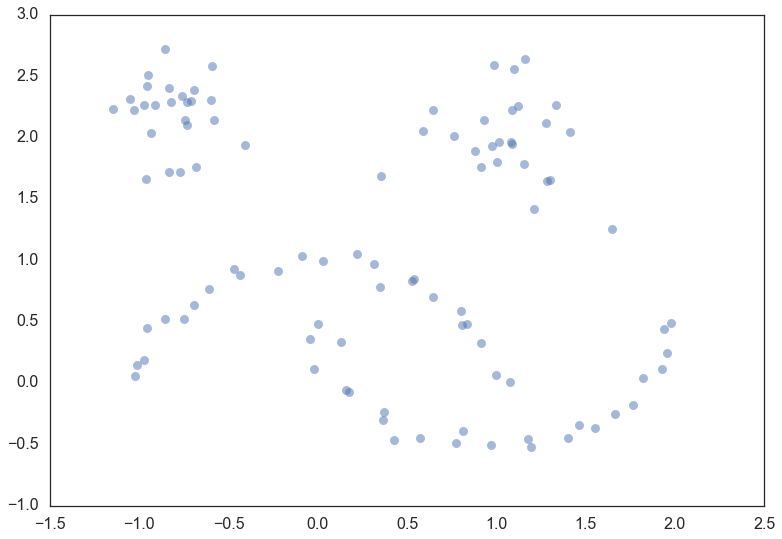
サンプルとして適用するデータ(引用元:https://hdbscan.readthedocs.io/en/latest/how_hdbscan_works.html)
下図のデータに最小距離法を適用する。
圧縮前樹形図(引用元:https://hdbscan.readthedocs.io/en/latest/how_hdbscan_works.html)
2. 樹形図の圧縮
2-1 ハイパーパラメータを用いた圧縮
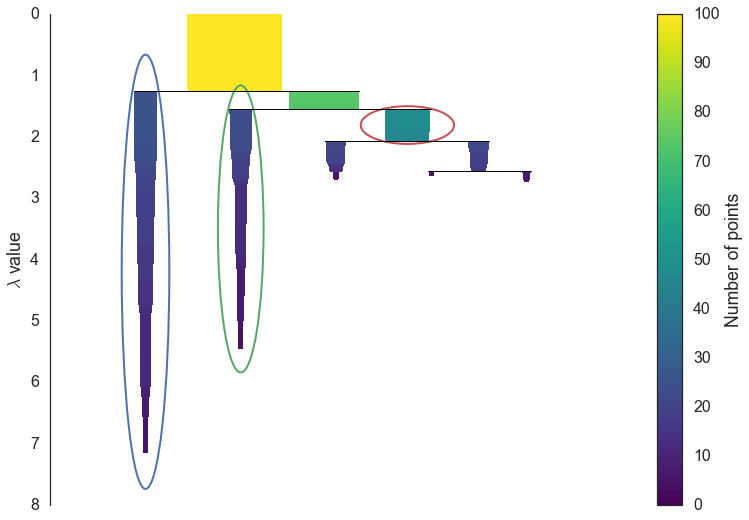
圧縮後樹形図(引用元:https://hdbscan.readthedocs.io/en/latest/how_hdbscan_works.html)
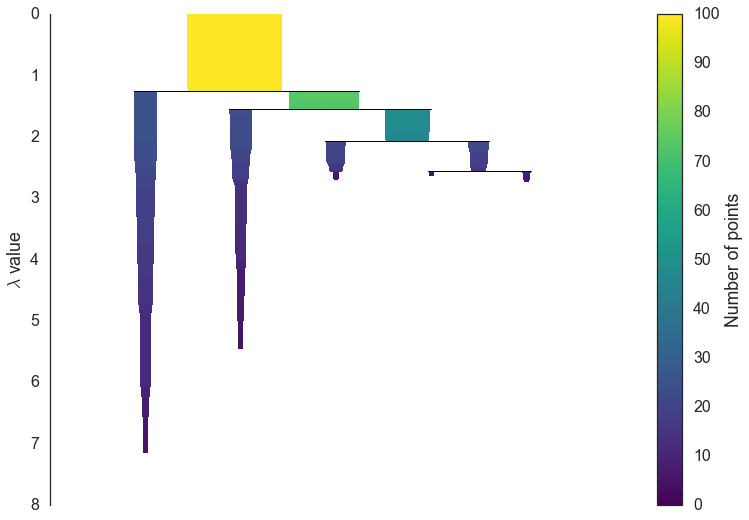
圧縮方法
ハイパーパラメータ : min_cluster_size
樹形図をベースにして、トップダウンでクラスタを分割する。
min_cliuster_size未満のクラスタ生成時、そのクラスタはノイズ?外れ値?として扱う。
3. クラスタ抽出
3-1 評価指標 S (Stability)を定義
密度関数から評価指標Sを算出する。(論文の画像引用して良いかわからなかったので落書き)
間違えていました:$C_1$は樹形図でいうroot扱いのため、$C_2$~$C_K$です。
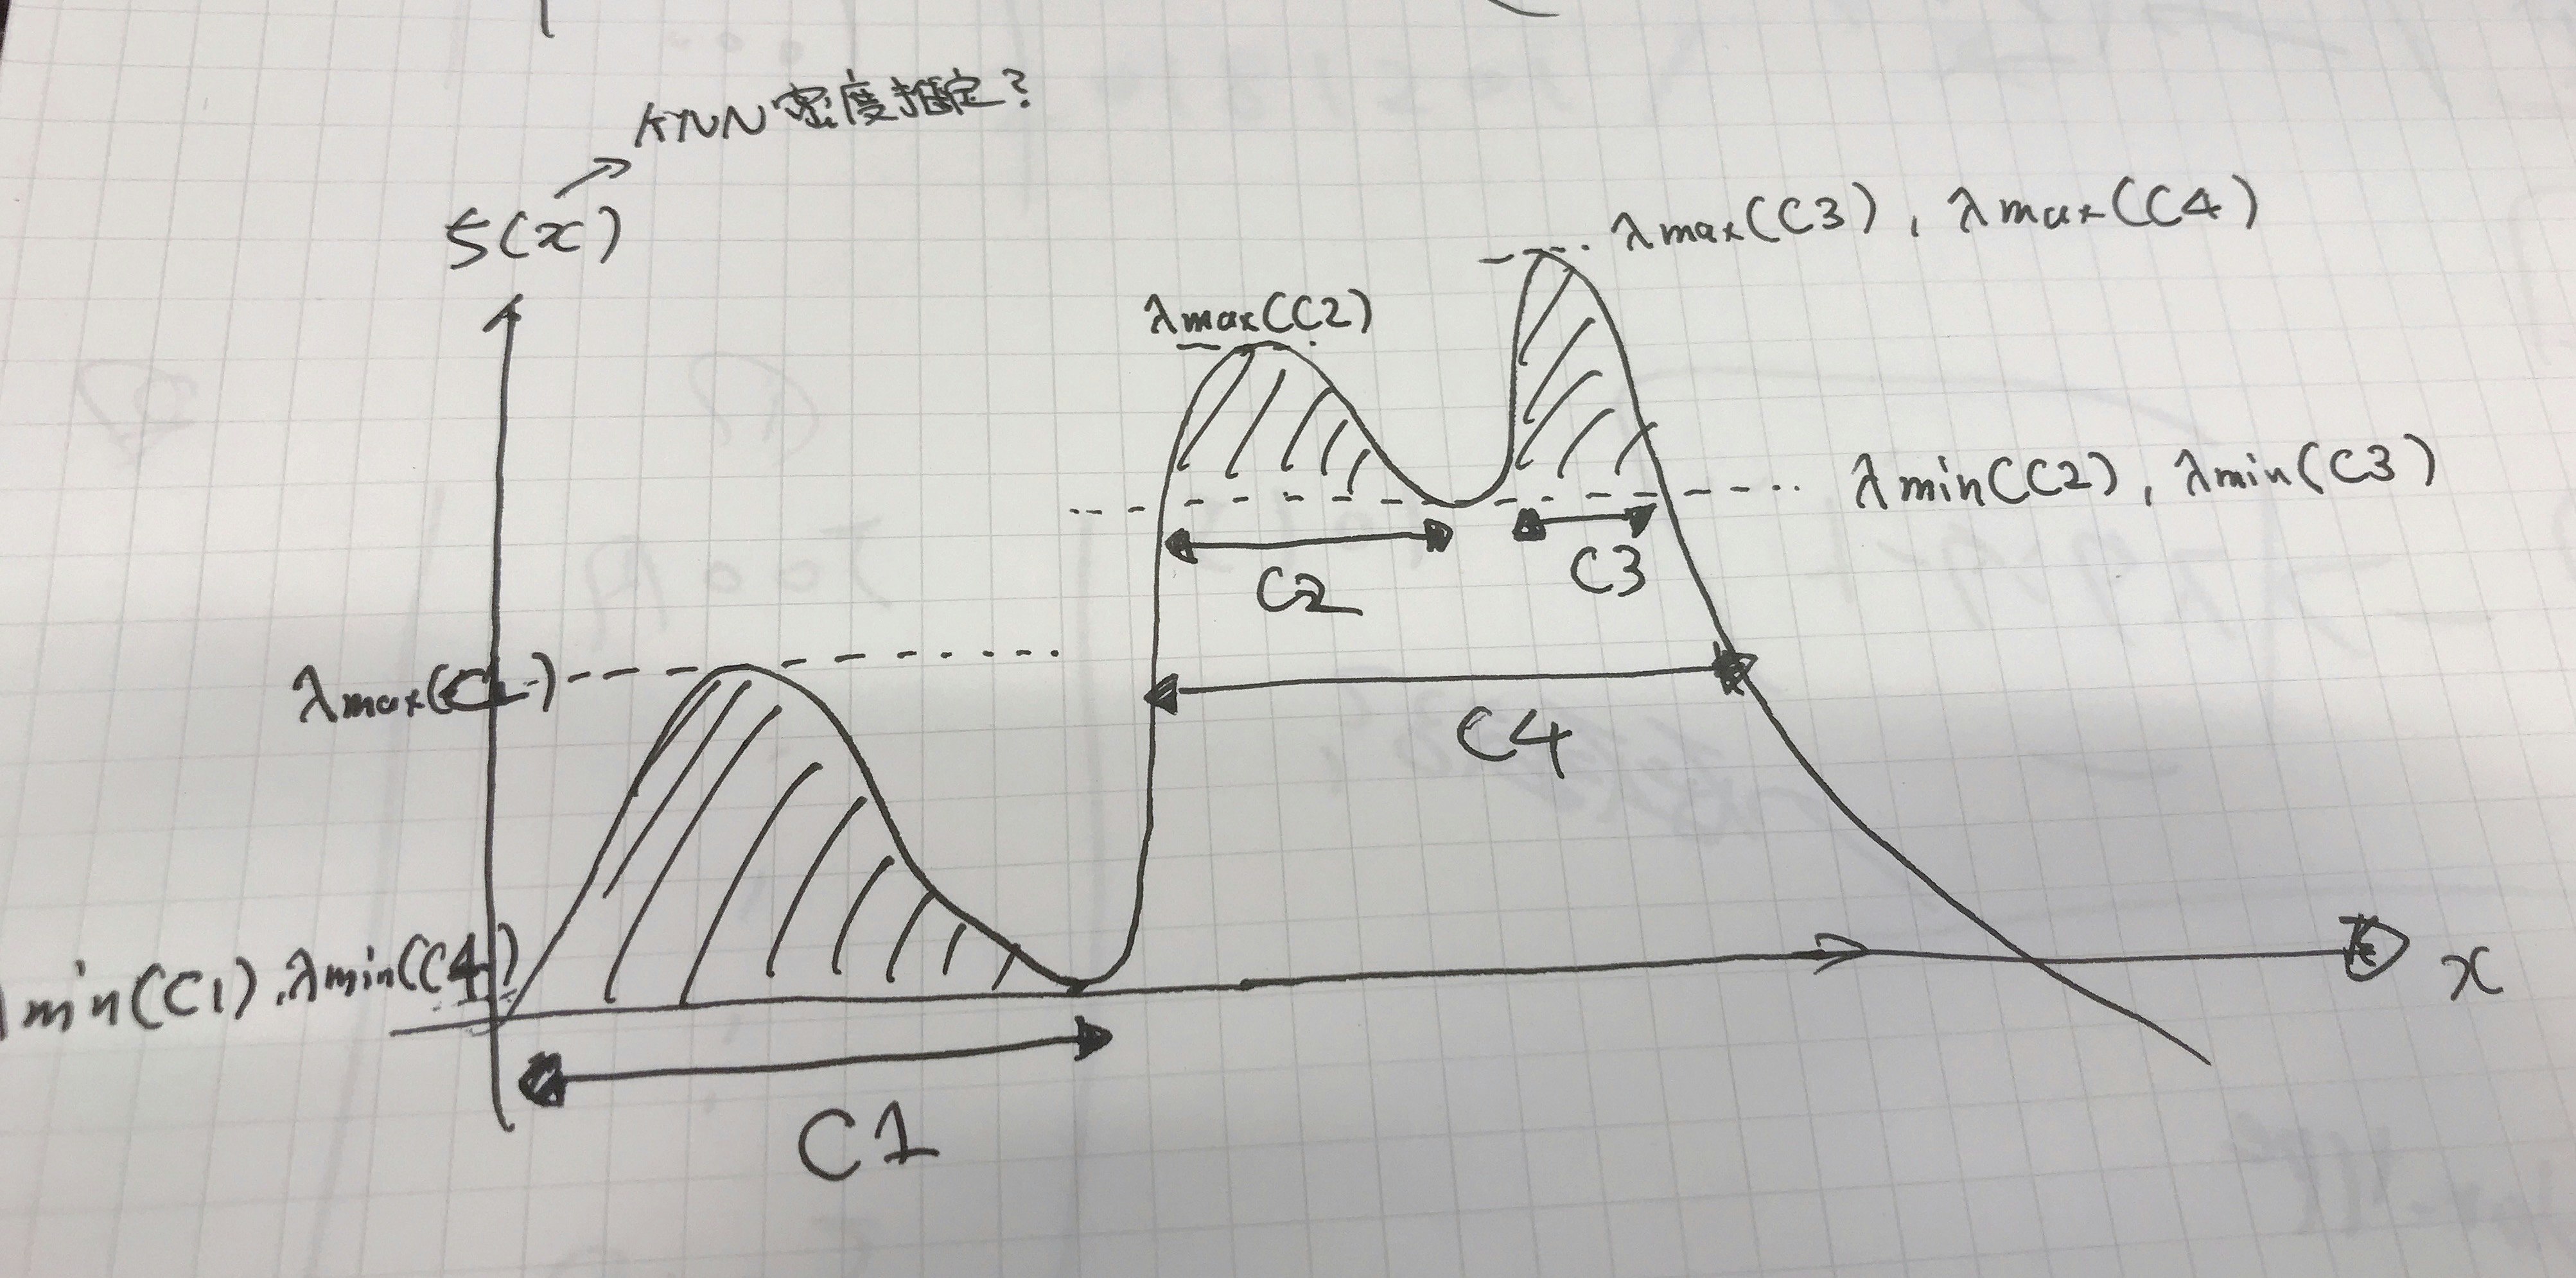
\begin{align}
\lambda_{\max}(x,\,C_i) &= \min \{f(x),\, \lambda_{\max}(C_i) \}\\
S(C_i) &= \sum_{x_{j} \in C_{i}}(\lambda_{\max}(x_j,\,C_i)-\lambda_{\min}(C_{i}))
\end{align}
上記式より各クラスタの評価指標Sが求まる。
3-2 Sを用いた目的関数の最適化
目的関数Jを
\begin{align}
J = \sum_{i=2}^K\delta_{i}S(C_i)
\end{align}
制約条件を
\begin{align}
&\delta_i\in\{0,1\},\, i=2, \cdots K \\
&\sum_{j\in {\bf I}_h}\delta_j=1, \, ^\forall h \in {\bf L}
\end{align}
とする。
論文内文章引用
「$\delta_i(i=2,\cdots K)$ indicates whether cluster $C_i$ is included in the flat solution ($\delta_i=1$) or not ($\delta_i=0$)」
「${\bf L} =$ $\{$$h|C_h$ is a leaf cluster$\}$ is the set of indexes of leaf clusters」
「${\bf I}_h = \{ j ~|~ j \neq 1$ and $C_j$ is ascendant of $C_h$ ($h$ included) $\}$ is the set of indexes of all clusters on the path from $C{h}$ to the root (excluded)」←下付き文字表示できない謎
要するに
目的関数→抽出クラスタのSの和
制約条件→抽出クラスタ1つで$\delta$は合計1 (多分)
上記の目的関数を最大化する。
最適化アルゴリズム
STEP1: 初期値を設定する。
\delta_2=\cdots \delta_K=1 、\hat{S}(C_h)=S(C_h)
STEP2: 一番深いところからボトムアップでスタートして、下記の処理を実行
IF $S(C_i) < \hat{S}(C_{i_l}) + \hat{S}(C_{i_l})$ :
\begin{align}
S(C_i) &= \hat{S}(C_{i_l}) + \hat{S}(C_{i_r}) \\
\delta_i &= 0
\end{align}
※$l$はleft node, $r$はright node
ELSE :
\begin{align}
\hat{S}(C_{i}) &= S(C_{i}) \\
\delta_{(\cdot)} &= 0, ^\forall \mbox{cluster's in}~ C_i \mbox{,s subtrees}
\end{align}
$\hat{S}(C_{i})$は以下の式を用いる。
\begin{align}
\hat{S}(C_i) = \left\{
\begin{array}{l}
S(C_i)\\
\max\{S(C_i),~ \hat{S}(C_{i_l}) + \hat{S}(C_{i_r})\}
\end{array}
\right.
\end{align}
抽出後イメージ(引用元:https://hdbscan.readthedocs.io/en/latest/how_hdbscan_works.html)
Pythonで実行
pip install
$pip install hdbscan
import
import hdbscan #numpy-1.16.1で動くのを確認
実行
clusterer = hdbscan.HDBSCAN(gen_min_span_tree=True, min_cluster_size=10)
clusterer.fit(data)
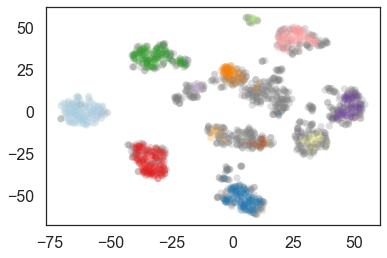
digitsデータに適用してみた結果(t-sneで描画, min_cluster_size=10)
以上!!
元気があればもう少し詳しく書くかも
参考
論文 : https://link.springer.com/chapter/10.1007/978-3-642-37456-2_14
The hdbscan Clustering Library : https://hdbscan.readthedocs.io/en/latest/index.html
How HDBSCAN Works(notebook) : https://github.com/scikit-learn-contrib/hdbscan/blob/master/notebooks/How%20HDBSCAN%20Works.ipynb