ggplot2のエラーパターンを学ぶための学習アプリ
はじめに
最近ふと思うことですが、ChatGPTやらを使って知識がなくても、なんちゃってプログラミングができるような時代になってしまいました。
これはまちがいなく良いことだとは思いますが、
僕が研究室に入ったころはそんなものなくて、Rのggplot2にすら頭を悩ませていました。
そんな時代をみなさんにも思い出してほしいということで、ちょっとしたshinyアプリをつくってみました。普段意識しないggplot2と向き合ってみませんか?
アプリケーションの概要
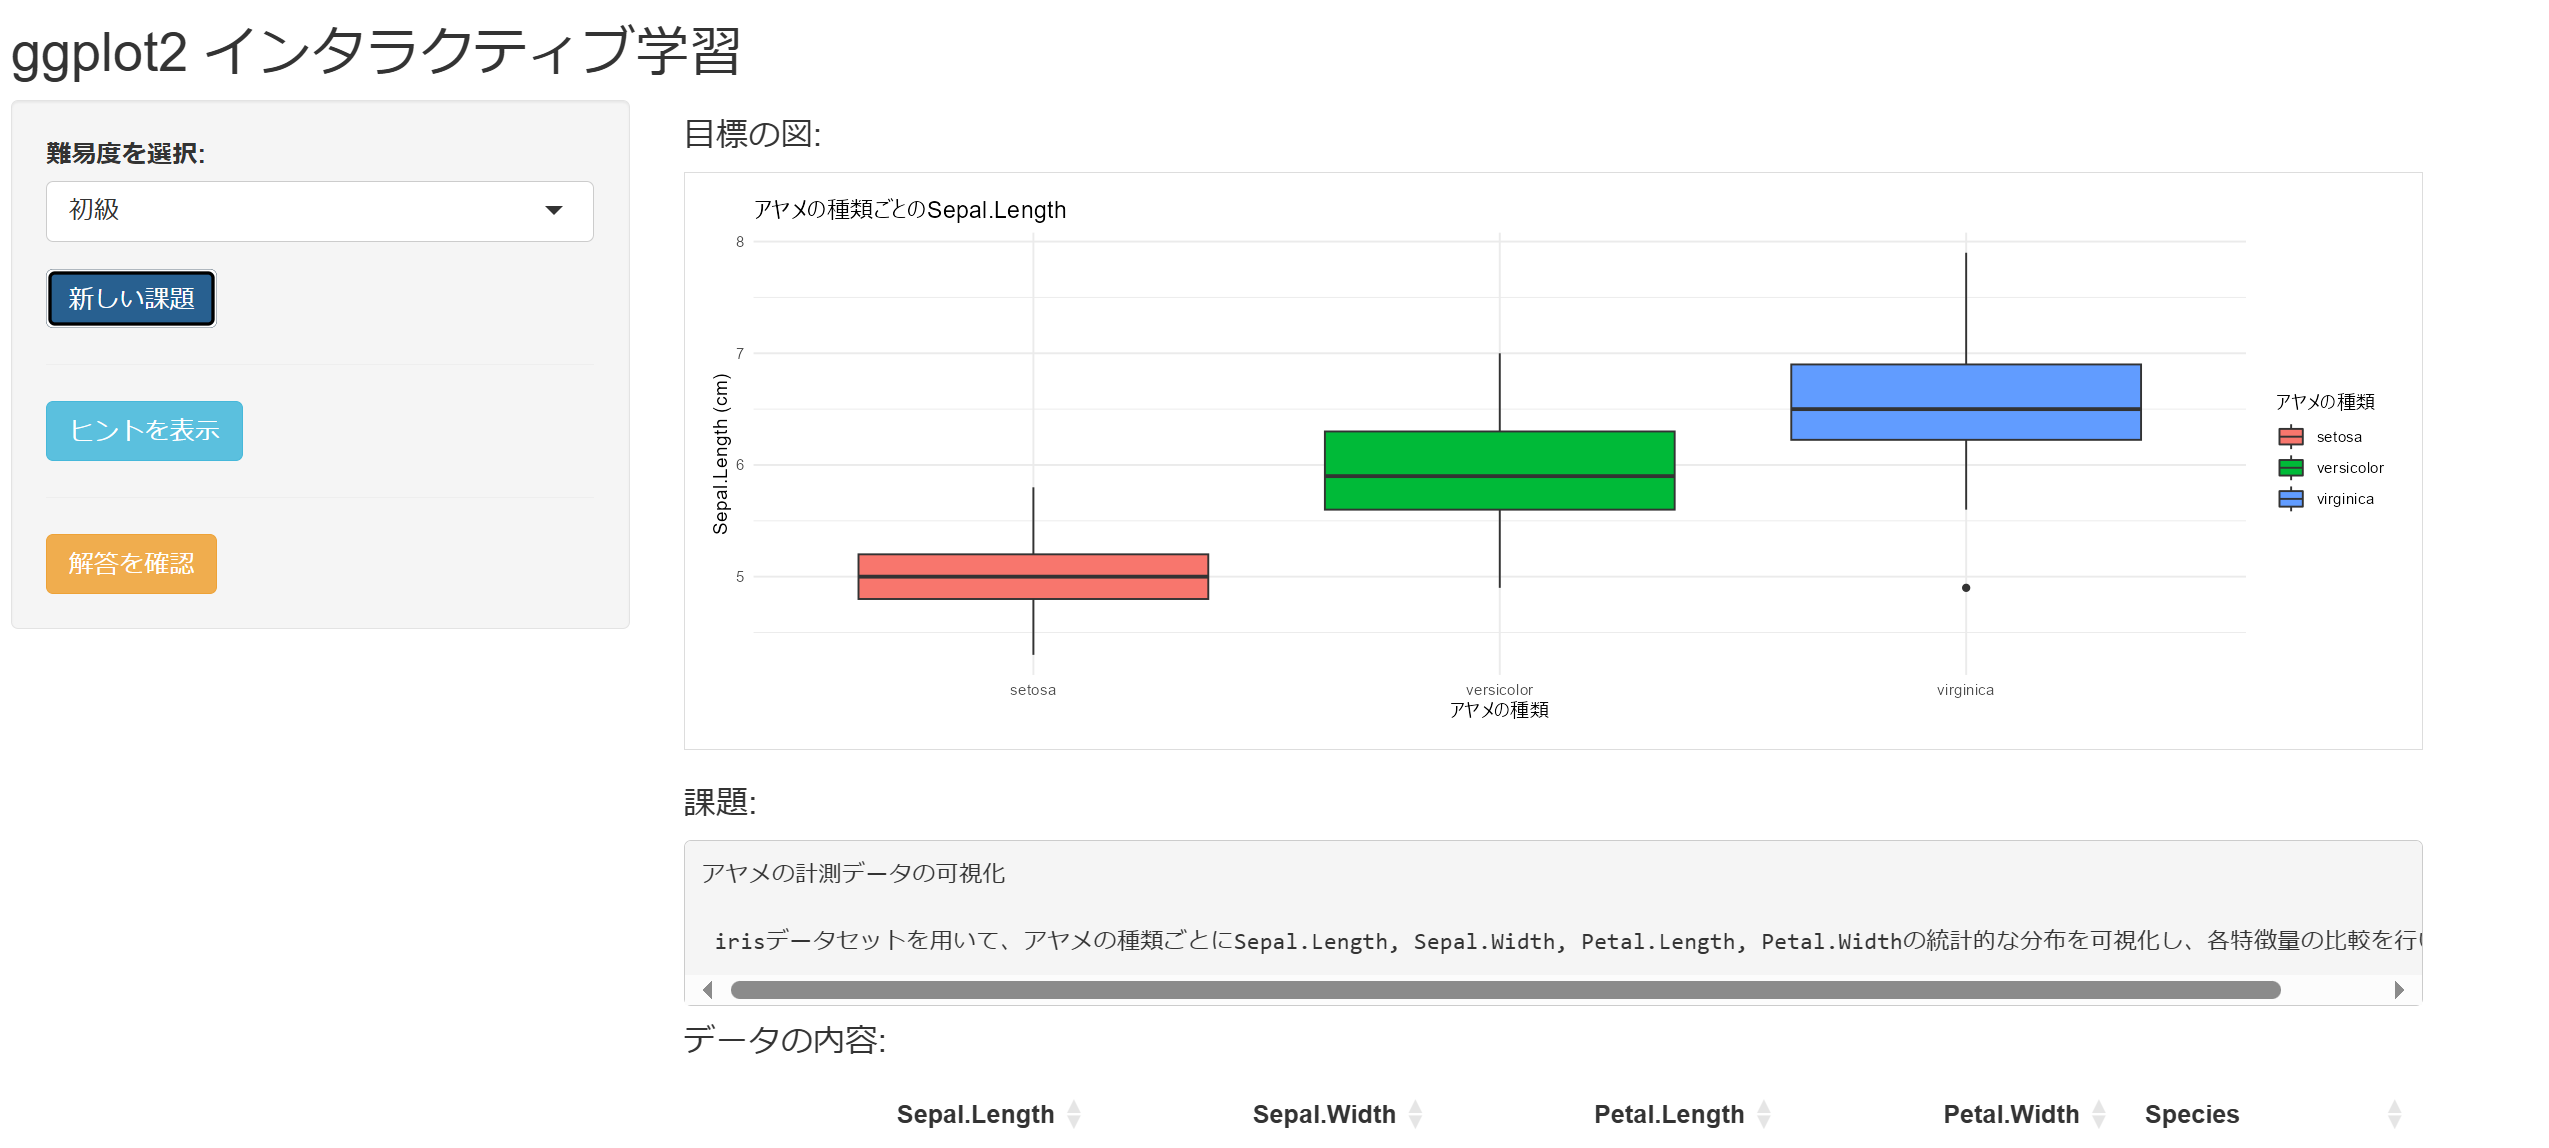
今回つくったshinyアプリはRのggplot2を使って作図するときによくありそうなエラーを体験してもらうためのものです。

主な特徴
とりあえずGemini APIにggplot2でよくありそうな間違いを難易度別に生成してもらえるので、無限にデバッグ作業をすることができます。
目標の図がまず生成されて、この図を作成することを目指します。
なんか変な図ができちゃう。。
そして目標の図をつくるためにあなたが書いているスクリプト例が下に生成されますが、なんか違う図ができちゃいます。なのでこのスクリプトを頑張って直してみてください。(初心者のころを思い出しますね)
わからなかったらヒントももらえます!
ヒントボタンを押すと段階的にヒントがもらえます。(こんな先輩みなさんにもいましたか?)

正解も解説付き!(たまに変なこと言いますので注意)
上級は意外と難しい?
普通にめんどくさそうな図の作成が課題になります。
(それにしてもあんまりセンスのないプロットですね。。)
どうか調べないでやってみてほしい。

今回はggplotだけです。
geminiに生成してもらう課題を好きなようにカスタマイズすれば、みなさんの好きなデバッグ作業を無限にすることができます。年末年始はデバッグ沼にはまってみてはいかかでしょうか?
## shinyアプリ用のスクリプト

library(shiny)
library(gemini.R)
library(ggplot2)
library(DT)
library(shinyAce)  # aceEditorのために必要

# Gemini APIの設定
tryCatch({
  setAPI("Your API KEY")
}, error = function(e) {
  warning("Gemini API key not found. Using predefined patterns only.")
})

# データセット情報
DATASETS_INFO <- list(
  iris = list(
    name = "iris",
    description = "アヤメの測定データ",
    variables = "数値変数: Sepal.Length, Sepal.Width, Petal.Length, Petal.Width\nカテゴリ変数: Species"
  ),
  mtcars = list(
    name = "mtcars",
    description = "自動車の性能データ",
    variables = "数値変数: mpg, disp, hp, drat, wt, qsec\nカテゴリ変数: cyl, vs, am, gear, carb"
  ),
  airquality = list(
    name = "airquality",
    description = "ニューヨークの大気質データ",
    variables = "数値変数: Ozone, Solar.R, Wind, Temp\n時間変数: Month, Day"
  ),
  diamonds = list(
    name = "diamonds",
    description = "ダイヤモンドの特性と価格のデータ",
    variables = "数値変数: carat, depth, table, price, x, y, z\nカテゴリ変数: cut, color, clarity"
  )
)
# データセット固有の変数情報を取得する関数
get_dataset_variables <- function(dataset_name) {
  data <- get(dataset_name)
  numeric_cols <- names(data)[sapply(data, is.numeric)]
  if (length(numeric_cols) < 2) {
    stop("データセットに十分な数値列がありません")
  }
  list(
    x = numeric_cols[1],
    y = numeric_cols[2]
  )
}

generate_task_prompt <- function(difficulty, dataset_name, dataset_info) {
  # データセットの変数情報を取得
  data <- get(dataset_name)
  numeric_vars <- names(data)[sapply(data, is.numeric)]
  factor_vars <- names(data)[sapply(data, is.factor)]
  if (!is.null(factor_vars)) {
    factor_vars <- paste(factor_vars, collapse = ", ")
  } else {
    factor_vars <- "なし"
  }

  # 優先的に使用する可視化手法の説明
  viz_methods <- switch(difficulty,
                        beginner = "箱ひげ図(geom_boxplot)やドットプロット(geom_dotplot)を中心に、基本的な統計的可視化を行う。",
                        intermediate = "バイオリンプロット(geom_violin)や棒グラフ(geom_bar/geom_col)を使用し、さらにポイント(geom_jitter)を組み合わせるなど。",
                        advanced = "複数の統計的プロットの組み合わせ(バイオリン+箱ひげ図、積み上げ棒グラフ、グループ化されたドットプロットなど)や、facet_wrapやfacet_gridによる分割表示。"
  )

  sprintf('以下の条件でR言語のデータ可視化課題を生成し、必ず指定されたJSON形式で返してください。
説明などは一切不要です。

データセット情報:
- 名前: %s
- 説明: %s
- 数値変数: %s
- カテゴリ変数: %s
- 難易度: %s
- 優先的な可視化手法: %s

以下の形式でJSONを返してください:
{
  "title": "課題のタイトル",
  "description": "課題の説明(統計的な特徴を可視化する目的を含める)",
  "correct_code": "完全なggplotコード(theme_minimal()とlabs()を必ず含める)",
  "buggy_code": "不完全なggplotコード(改善が必要な状態のコード)",
  "hints": [
    "問題の修正に役立つヒント1",
    "問題の修正に役立つヒント2",
    "問題の修正に役立つヒント3"
  ],
  "plot_description": "完成した可視化の説明"
}

注意事項:
1. library(ggplot2)を必ず含める
2. 散布図(geom_point)は極力避け、代わりに箱ひげ図、バイオリンプロット、ドットプロット、棒グラフを優先的に使用
3. カテゴリ変数がある場合は、それを活用したグループ化や色分けを行う
4. 統計的な分布や傾向を把握しやすい可視化を心がける
5. コード内の改行は\\nで表現
6. コード内の引用符は適切にエスケープ
7. JSONとして正しい形式を維持',
          dataset_name,
          dataset_info$description,
          paste(numeric_vars, collapse = ", "),
          factor_vars,
          difficulty,
          viz_methods
  )
}

generate_task <- function(difficulty) {
  dataset_name <- sample(names(DATASETS_INFO), 1)
  dataset_info <- DATASETS_INFO[[dataset_name]]

  tryCatch({
    prompt <- generate_task_prompt(difficulty, dataset_name, dataset_info)
    cat("Generated prompt:\n", prompt, "\n\n")

    response <- gemini(prompt)
    cat("API Response:\n", response, "\n\n")

    # 応答のクリーニングを改善
    clean_response <- function(text) {
      # コードブロックを削除
      text <- gsub("```json\\s*|```\\s*", "", text)
      # 先頭と末尾の空白を削除
      text <- trimws(text)
      # 最初の{から最後の}までを抽出
      json_start <- regexpr("\\{", text)
      json_end <- tail(gregexpr("\\}", text)[[1]], 1)
      if (json_start == -1 || json_end == -1) {
        return(NULL)
      }
      substr(text, json_start, json_end)
    }

    json_text <- clean_response(response)
    if (is.null(json_text)) {
      cat("Failed to extract valid JSON from response\n")
      return(create_fallback_task(dataset_name, dataset_info))
    }

    # JSONの構文チェック
    validate_json <- function(text) {
      tryCatch({
        jsonlite::validate(text)
        TRUE
      }, error = function(e) FALSE)
    }

    if (!validate_json(json_text)) {
      cat("Invalid JSON format\n")
      return(create_fallback_task(dataset_name, dataset_info))
    }

    task <- jsonlite::fromJSON(json_text)

    # 必須フィールドの検証を強化
    validate_task <- function(task) {
      required_fields <- c("title", "description", "correct_code", "buggy_code", "hints", "plot_description")

      # すべてのフィールドが存在することを確認
      if (!all(required_fields %in% names(task))) {
        return(FALSE)
      }

      # 各フィールドの型を確認
      if (!is.character(task$title) || !is.character(task$description) ||
          !is.character(task$correct_code) || !is.character(task$buggy_code) ||
          !is.character(task$plot_description) || !is.vector(task$hints)) {
        return(FALSE)
      }

      # コードにライブラリ呼び出しが含まれていることを確認
      if (!grepl("library\\(ggplot2\\)", task$correct_code) ||
          !grepl("library\\(ggplot2\\)", task$buggy_code)) {
        return(FALSE)
      }

      TRUE
    }

    if (!validate_task(task)) {
      cat("Task validation failed\n")
      return(create_fallback_task(dataset_name, dataset_info))
    }

    task$dataset <- dataset_name
    return(task)

  }, error = function(e) {
    cat("Error in task generation:", e$message, "\n")
    return(create_fallback_task(dataset_name, dataset_info))
  })
}
# UI定義
ui <- fluidPage(
  tags$head(
    tags$style(HTML("
      .ace_editor { height: 200px !important; }
      .plot-container {
        border: 1px solid #ddd;
        padding: 10px;
        margin-bottom: 20px;
        background-color: white;
      }
      .error-message {
        color: red;
        font-weight: bold;
        margin-top: 10px;
      }
      .hint-panel {
        background-color: #f8f9fa;
        padding: 15px;
        border-radius: 5px;
        margin-top: 10px;
      }
      .answer-panel {
        background-color: #e9ecef;
        padding: 15px;
        border-radius: 5px;
        margin-top: 10px;
      }
    "))
  ),

  titlePanel("ggplot2 インタラクティブ学習"),

  sidebarLayout(
    sidebarPanel(
      selectInput("difficulty",
                  "難易度を選択:",
                  choices = c(
                    "初級" = "beginner",
                    "中級" = "intermediate",
                    "上級" = "advanced"
                  ),
                  selected = "beginner"),
      actionButton("new_task", "新しい課題", class = "btn-primary"),
      hr(),
      actionButton("show_hint", "ヒントを表示", class = "btn-info"),
      hr(),
      actionButton("show_answer", "解答を確認", class = "btn-warning"),
      width = 3
    ),

    mainPanel(
      h4("目標の図:"),
      div(class = "plot-container",
          plotOutput("target_plot", height = "300px")
      ),

      h4("課題:"),
      verbatimTextOutput("task_description"),

      h4("データの内容:"),
      DTOutput("data_preview"),

      h4("コードを編集:"),
      div(
        style = "position: relative;",
        aceEditor(
          "code_editor",
          mode = "r",
          theme = "tomorrow",
          value = "",
          height = "200px",
          fontSize = 14
        ),
        actionButton(
          "run_code",
          "実行",
          class = "btn-success",
          style = "position: absolute; right: 10px; top: 10px;"
        )
      ),

      h4("あなたの図:"),
      div(class = "plot-container",
          plotOutput("user_plot", height = "300px")
      ),

      verbatimTextOutput("execution_result"),

      uiOutput("hints_panel"),

      uiOutput("answer_panel")
    )
  )
)

# サーバーロジック
server <- function(input, output, session) {
  # 状態管理
  values <- reactiveValues(
    current_task = NULL,
    hint_counter = 0,
    answer_shown = FALSE,
    error_message = NULL
  )

  # 新しい課題を生成
  observeEvent(input$new_task, {
    values$hint_counter <- 0
    values$answer_shown <- FALSE
    values$error_message <- NULL

    withProgress(message = '課題を生成中...', {
      task <- generate_task(input$difficulty)
      if (!is.null(task)) {
        values$current_task <- task
        updateAceEditor(session, "code_editor", value = task$buggy_code)
      } else {
        showNotification("課題の生成に失敗しました。もう一度お試しください。",
                         type = "error")
      }
    })
  })

  # 目標プロット
  output$target_plot <- renderPlot({
    req(values$current_task)

    tryCatch({
      eval(parse(text = values$current_task$correct_code))
    }, error = function(e) {
      plot.new()
      title(main = "エラー: 正解のコードを実行できません", col.main = "red")
    })
  })

  # 課題説明
  output$task_description <- renderText({
    req(values$current_task)
    paste(values$current_task$title, "\n\n", values$current_task$description)
  })

  # データプレビュー
  output$data_preview <- renderDT({
    req(values$current_task)

    data <- get(values$current_task$dataset)
    datatable(
      data,
      options = list(
        pageLength = 5,
        scrollX = TRUE,
        dom = 'tlip'
      ),
      rownames = TRUE,
      filter = 'top'
    )
  })

  # ユーザープロット
  output$user_plot <- renderPlot({
    req(input$run_code)

    isolate({
      code <- input$code_editor
      tryCatch({
        eval(parse(text = code))
      }, error = function(e) {
        values$error_message <- e$message
        plot.new()
        title(main = paste("エラー:", e$message), col.main = "red")
      })
    })
  })

  # 実行結果
  output$execution_result <- renderText({
    req(input$run_code)

    if (!is.null(values$error_message)) {
      paste("エラー:", values$error_message)
    } else {
      "コードは正常に実行されました"
    }
  })

  # ヒントパネル
  output$hints_panel <- renderUI({
    req(values$hint_counter > 0, values$current_task)

    hints <- values$current_task$hints[1:min(values$hint_counter,
                                             length(values$current_task$hints))]

    div(class = "hint-panel",
        h4("ヒント:"),
        lapply(seq_along(hints), function(i) {
          div(
            style = "margin-bottom: 10px;",
            tags$b(paste("ヒント", i, ":")),
            p(hints[i])
          )
        })
    )
  })

  # 解答パネル
  output$answer_panel <- renderUI({
    req(values$answer_shown, values$current_task)

    div(class = "answer-panel",
        h4("正解のコード:"),
        div(
          style = "background-color: #f8f9fa; padding: 15px; border-radius: 5px;",
          tags$pre(
            style = "margin: 0;",
            values$current_task$correct_code
          )
        ),
        h4("説明:", style = "margin-top: 15px;"),
        p(values$current_task$plot_description)
    )
  })

  # ヒント表示
  observeEvent(input$show_hint, {
    req(values$current_task)
    if (values$hint_counter < length(values$current_task$hints)) {
      values$hint_counter <- values$hint_counter + 1
    }
  })

  # 解答表示
  observeEvent(input$show_answer, {
    req(values$current_task)
    values$answer_shown <- TRUE
  })
}

# アプリケーションの実行
shinyApp(ui = ui, server = server)

