はじめに
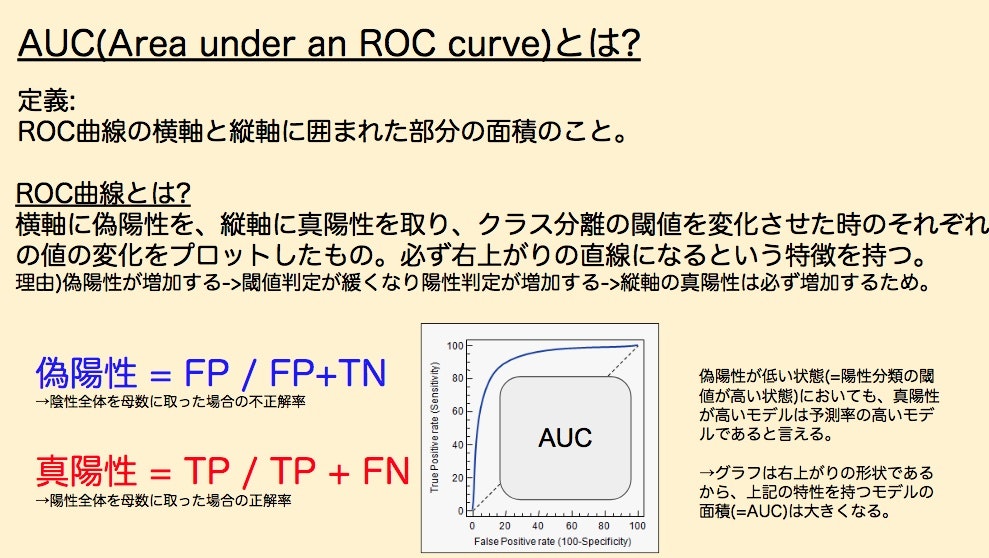
こちらの記事の内容を1枚絵にまとめたものになります。以下、文章で少しだけ補足します。

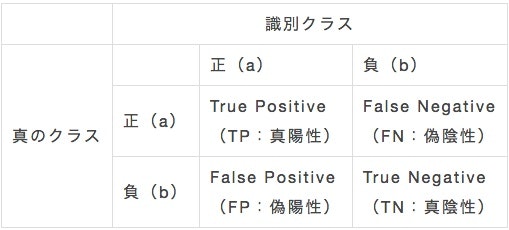
正解率系の各種指標について
(参考)こちらの記事より引用させて頂きました。

クラス分類モデルの性能評価には様々な評価指標が存在しますが、上記の各種指標の計算で諸々算出されます。
用語を覚える際に混乱してしまいがちですが、以下の関係性さえ理解しておけば丸暗記しなくても思い出せます。
前一文字:正解か不正解かを示す -> T or F
後一文字:モデルからの予測分類を示す -> P or N
偽陽性は、FP(間違って陽性判定した数) / FP + TN(陰性全体の母数)
真陽性は、TP(正しく陽性判定した数) / TP + FN(陽性全体の母数)
テキストでROC曲線とAUCをまとめる
①ROC曲線ってなんだ?
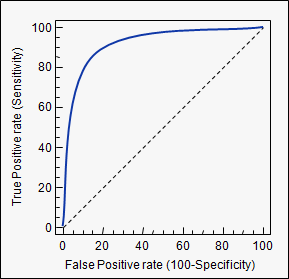
クラス分類するためのスコア閾値を外部の変数として変化させ、偽陽性率を横軸に、真陽性率を縦軸にプロットしたものがROC曲線に当たります。'偽陽性率が0%の状態(⇨陽性への判定閾値が限りなく高い)で、真陽性率が高いモデル'が予測率の高いモデルと言えます。
②グラフをどう解釈する?
"スコアが0.999999以上のみを陽性と見なすよ!"という厳しい条件においても、陽性を正しく検出できるモデルは優れたモデルと言えますよね。偽陽性率(横軸)が0の状態というのは、まさに上記のような条件を再現したものだと言えます。(実際にクラス判定の閾値がいくらに設定されているかは、入力によって異なるので、あくまで例です。)
③どんなグラフになる?
そして、偽陽性率が高まる = (判定閾値が低くなり)陽性判定が増える = 真陽性は増えるという関係が常に成り立つので、ROC曲線は必ず右上がりになります。
④AUCはこういうもの
っで、あれば、初期の陽性率の立ち上がりが急カーブを描いている、曲線と横軸との間の面積が大きいモデルというのは、'偽陽性率が低い、陽性判定の閾値が高く、条件が厳しい段階から正しく分類できていたモデル'となるわけですから、__AUC(ROC曲線の横軸と縦軸に囲まれた部分の面積)__は分類モデルのパフォーマンス評価指標として有用なわけです。
Scikit-learnでAUCを計算する
roc_auc_score()に、正解ラベルと予測スコアを渡すとAUCを計算してくれます。
楽チンです。
import numpy as np
from sklearn.metrics import roc_auc_score
y = np.array([0, 0, 1, 1])
pred = np.array([0.1, 0.4, 0.35, 0.8])
roc_auc_score(y, pred)
クラス分類問題の精度評価指標はいくつかありますが、案件に応じて最適なものを使い分けていましょう。
正解率とAUCを計算して最適なモデルを選択するスクリプト
かなり冗長だが、学習過程で作ったコードを貼ってみました。
# import basice apis
import numpy as np
import pandas as pd
%matplotlib inline
from sklearn.datasets import load_breast_cancer
from sklearn.preprocessing import StandardScaler
from sklearn.neighbors import KNeighborsClassifier
from sklearn.linear_model import LogisticRegression
from sklearn.ensemble import GradientBoostingClassifier
from sklearn.pipeline import Pipeline
from sklearn.model_selection import train_test_split
from sklearn.metrics import accuracy_score
from sklearn.metrics import roc_auc_score
import pickle

# import Sample Data to learn models
dataset = load_breast_cancer()
X = pd.DataFrame(dataset.data, columns=dataset.feature_names)
y = pd.DataFrame(dataset.target, columns=['y'])

# cross-validation by holdout
X_train,X_test,y_train,y_test = train_test_split(X,
                                                 y,
                                                 test_size=0.20,
                                                 random_state=1)
# set pipelines for two different algorithms
pretrained_pipes = []
trained_pipes = []
pipe_knn = Pipeline([('scl',StandardScaler()),('est',KNeighborsClassifier())])
pipe_logistic = Pipeline([('scl',StandardScaler()),('est',LogisticRegression())])
pipe_gbc = Pipeline([('scl',StandardScaler()),('est',GradientBoostingClassifier())])

pretrained_pipes.append(pipe_knn)
pretrained_pipes.append(pipe_logistic)
pretrained_pipes.append(pipe_gbc)

# パイプラインの学習
for pipeline in pretrained_pipes:
    trained_pipe = pipeline.fit(X_train,y_train.as_matrix().ravel())
    trained_pipes.append(trained_pipe)

# パイプラインの評価(評価は指定指標の下で実施されるようにすること)
# 結果格納データフレーム生成用に各種配列を作成
result_clumns = ['name','accurate_rate','roc']
result_names = ['KNN','LOGISTIC','GBC']
result_accuracy = []
result_roc = []

# 各モデルで性能評価する
for pipeline in trained_pipes:
    result_accuracy.append(accuracy_score(y_test,pipeline.predict(X_test)))
    result_roc.append(roc_auc_score(y_test,pipeline.predict(X_test)))

#  リスト->ディクショナリ->データフレームに変換
values = [result_names,result_accuracy,result_roc]
result_dataframe = pd.DataFrame(dict(zip(result_clumns,values))).loc[:,['name','accurate_rate','roc']]
high_accurate_model = result_dataframe.sort_values(by=["accurate_rate"], ascending=False).iloc[0,[0]].values[0]
high_accurate_score = result_dataframe.sort_values(by=["accurate_rate"], ascending=False).iloc[0,[1]].values[0]
high_roc_model = result_dataframe.sort_values(by=["roc"], ascending=False).iloc[0,[0]].values[0]
high_roc_score = result_dataframe.sort_values(by=["roc"], ascending=False).iloc[0,[2]].values[0]

result_dataframe

#結果呼び出し用関数
def model_selection(test_score):
    if test_score == 'accurate':
        print('最も正解率が高かったのは',high_accurate_model,'で、その値は',round(high_accurate_score,4),'でした')
    elif test_score == 'auc':
        print('最もAUCが高かったのは',high_roc_model,'で、その値は',round(high_roc_score,4),'でした')
        result_dataframe
    else:
        print('エラー!model_selection関数には、auc か accurateを引数として渡してください。')

# 関数呼び出し
model_selection('accurate')
model_selection('auc')
model_selection('hogehoge')

>最も正解率が高かったのは LOGISTIC で、その値は 0.9825 でした
>最もROCが高かったのは LOGISTIC で、その値は 0.9762 でした
>エラー!model_selection関数には、auc か accurateを引数として渡してください。
