matplotlib でアニメーションを作成するには, matplotlib.animation.ArtistAnimation と matplotlib.animation.FuncAnimation というふたつの方法があります. ArtistAnimation の方が簡単で, これなら割と思い通りに作成できていたのですが, 事前にすべての要素を作成しメモリに保持するため重いという問題がありました. FuncAnimation は逐次的に生成するためより軽そうなのですが, どうも挙動がよくわからず, いつも面倒になって連番画像を書き出して後で mp4 に変換していました. なのでいい加減理解して使いこなそうと気合を入れて勉強してきました. これはそのまとめノートです.
基本
matplotlib.animation.FuncAnimation にアニメーションを作成するのに必要な情報を渡せばアニメーションを作成してくれます. なので理解すべきはその引数とこの関数の挙動です.
最初のふたつの引数は必須で, たいていはそれに加えて引数 frames, interval を設定すると思います.
- 第1引数
figはFigureです. これは普段からよく使っているので説明不要ですね. - 第2引数
funcが本題です. これは次小節で詳しく見ます. - 引数
framesは, 各フレームの「名前」に相当するものを生成するイテレータです. 例えばrange(128)やnp.linspace(0, 2*np.pi, 128)などを渡します. この場合, どちらもフレーム数128のアニメーションを作成します. - 引数
intervalはフレームを切り替える時間をミリ秒単位で指定します. デフォルトは200です.
FuncAnimation の考え方
FuncAnimation の考え方は次のコード例に集約されます. (API doc より引用)
for d in frames:
   artists = func(d, *fargs)
   fig.canvas.draw_idle()
   fig.canvas.start_event_loop(interval)
つまり, イテレータ frames を回して, 各「フレーム名」 d を関数 func に渡し, 帰ってきた artist を描画します. これを時間 interval おいて frames が終了するまで繰り返します. それだけです.
例1: 動く点P
という訳で, さっそくやってみましょう. x軸上を 0, 1, 2, ... と動いていく点Pのアニメーションを作成してみます. 今学んだことを素直にコードに落とすとこうなるでしょうか.
import matplotlib.pyplot as plt
from matplotlib.animation import FuncAnimation

fig = plt.figure()
ax = fig.add_subplot(111)

def update(frame):
    ax.plot(frame, 0, "o")

anim = FuncAnimation(fig, update, frames=range(8), interval=1000)

anim.save("c01.gif", writer="imagemagick") # 画面に表示させたい場合は plt.show() で良い
plt.close()
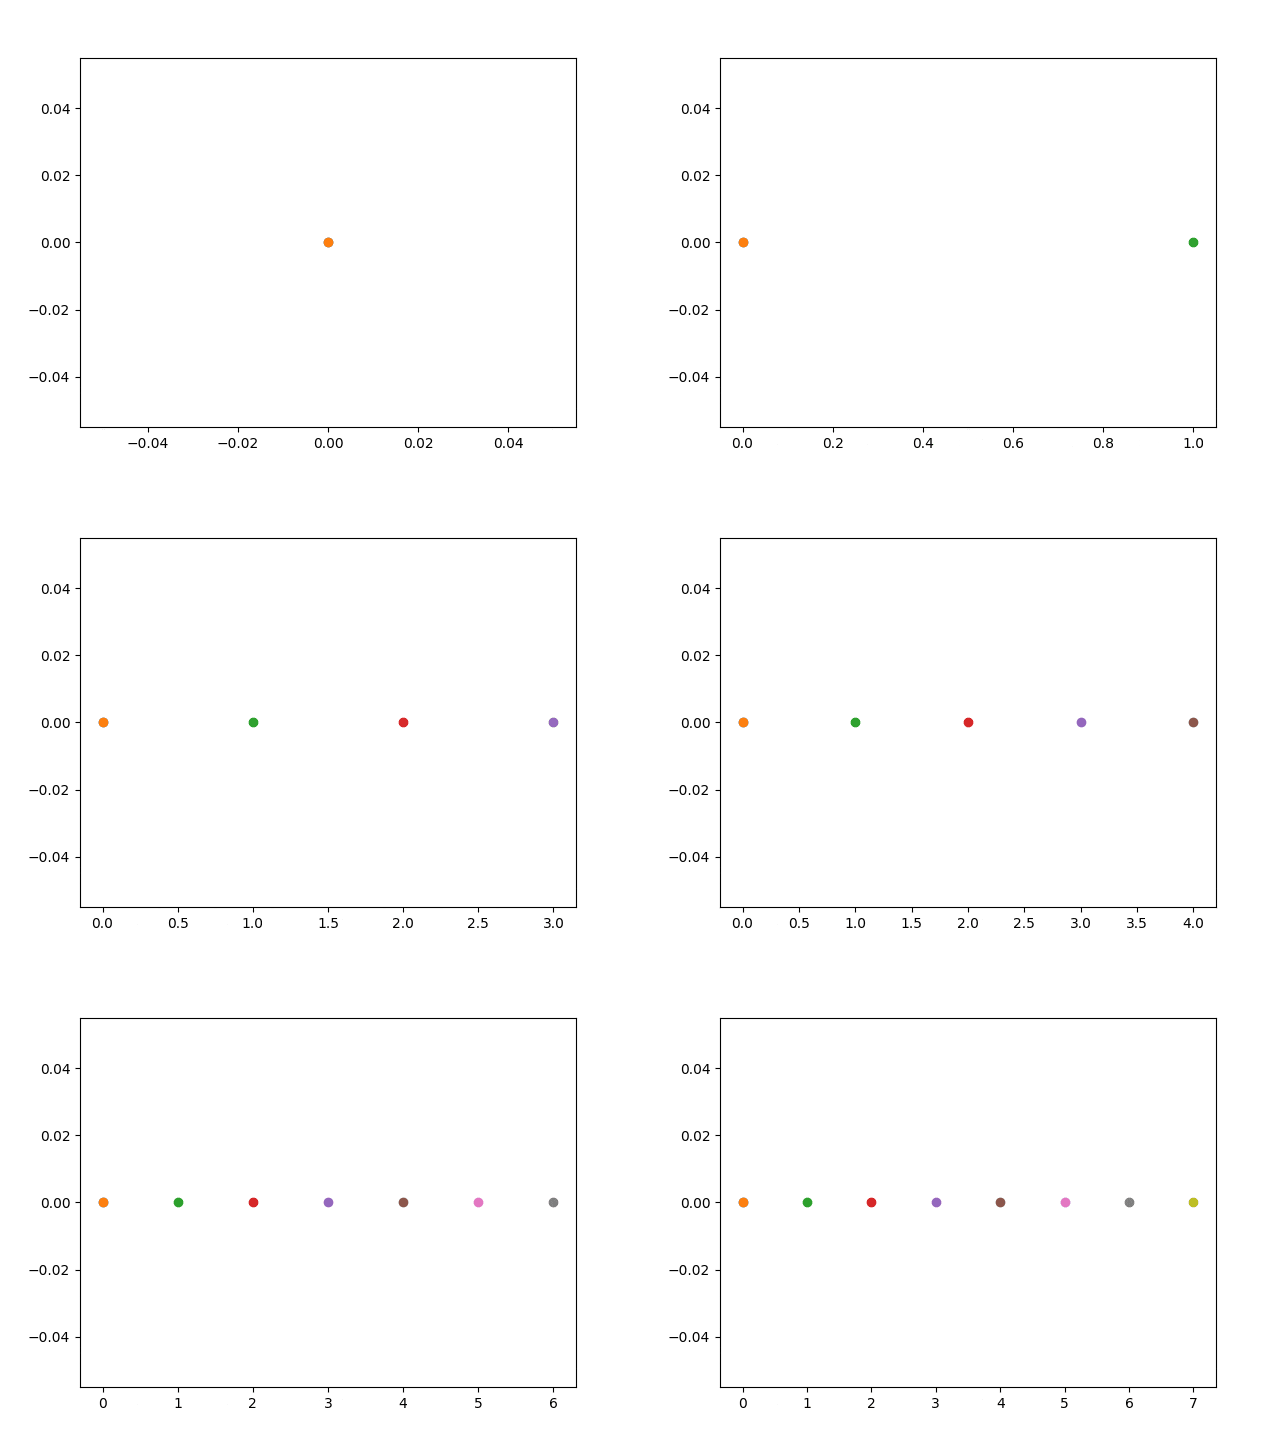
結果はこちら.
なんだか意図と違います. なにが違うかというと, 以前のフレームで描画した点Pの過去の位置がその後も描画されっぱなしになってしまっています. これを修正するには, update 関数の冒頭で axes に書き込まれている要素をすべてクリアすればよさそうです.
例2: 動く点P (修正版)
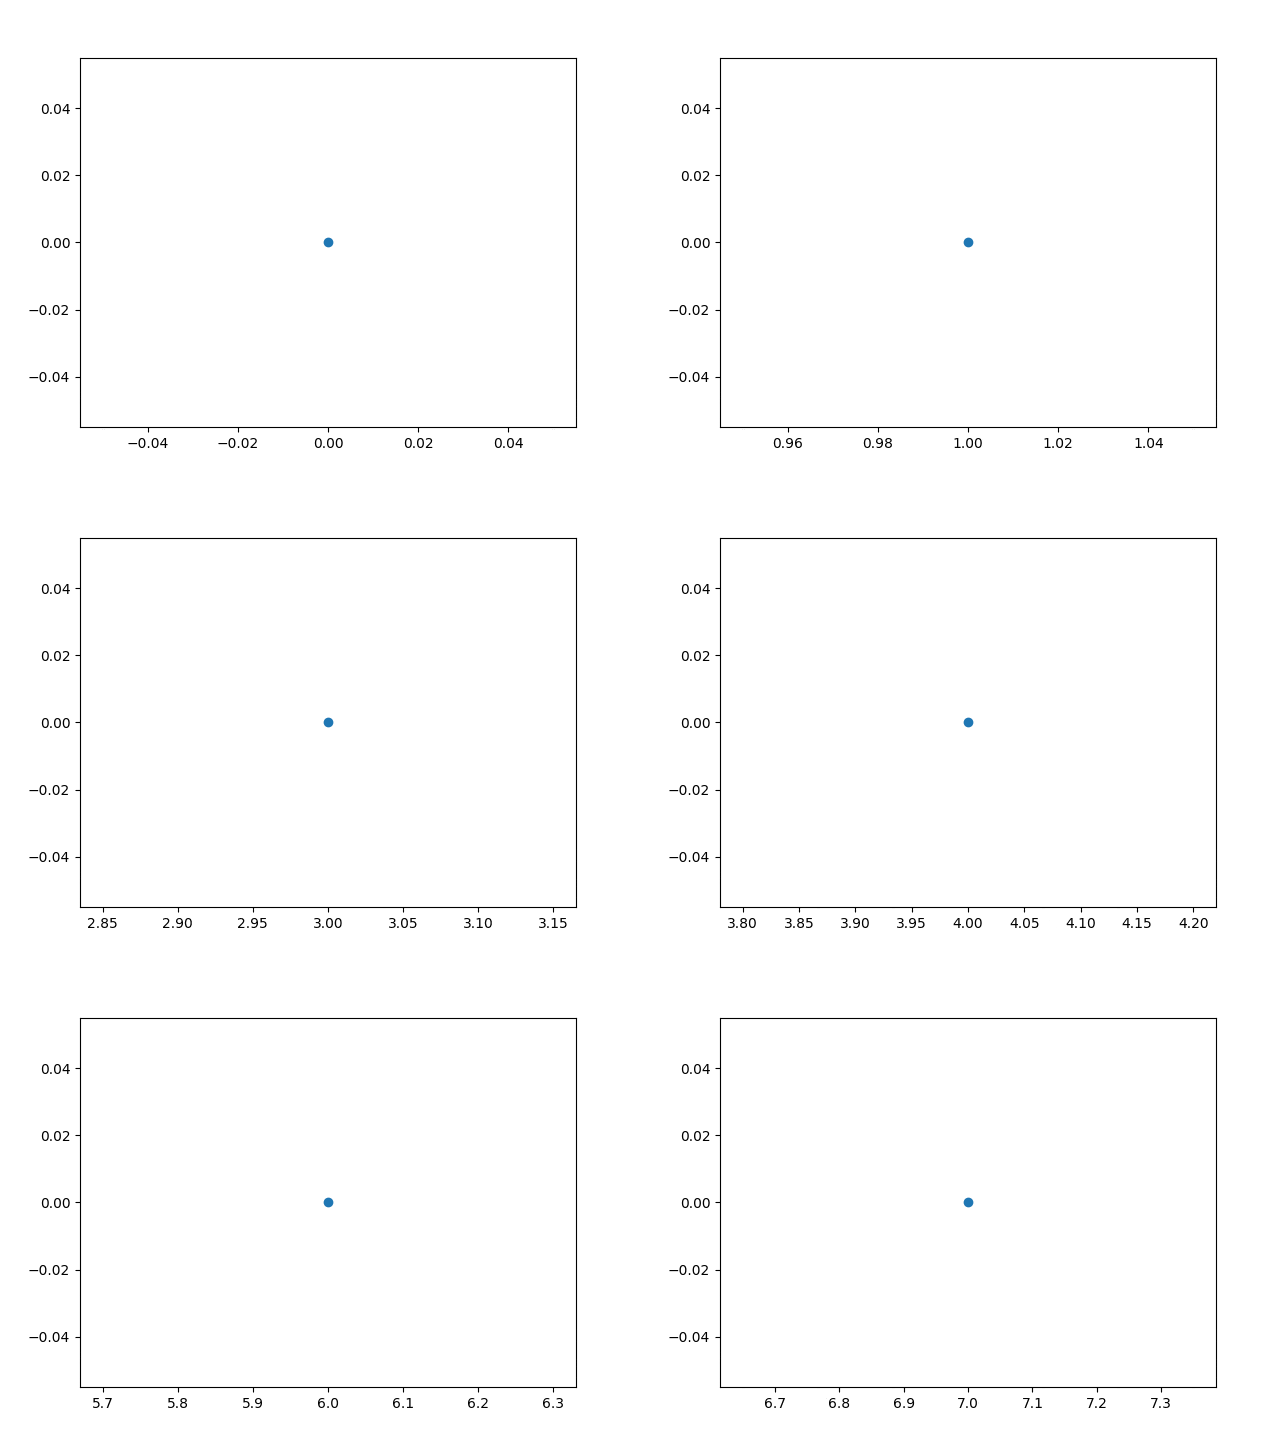
という訳で, 修正版のコードおよび実行結果がこちらです.
import matplotlib.pyplot as plt
from matplotlib.animation import FuncAnimation

fig = plt.figure()
ax = fig.add_subplot(111)

def update(frame):
    ax.cla() # ax をクリア
    ax.plot(frame, 0, "o")

anim = FuncAnimation(fig, update, frames=range(8), interval=1000)

anim.save("c02.gif", writer="imagemagick")
plt.close()
意図通りのアニメーションができました.
注意として, ax.cla() を呼ぶと軸ラベル ax.set_xlabel() やグリッド線 ax.grid(), 描画範囲 ax.set_xlim() などもクリアされてしまうため, ax.cla() を読んだ後に再設定する必要があります.
応用
特定の Artist のみをクリア
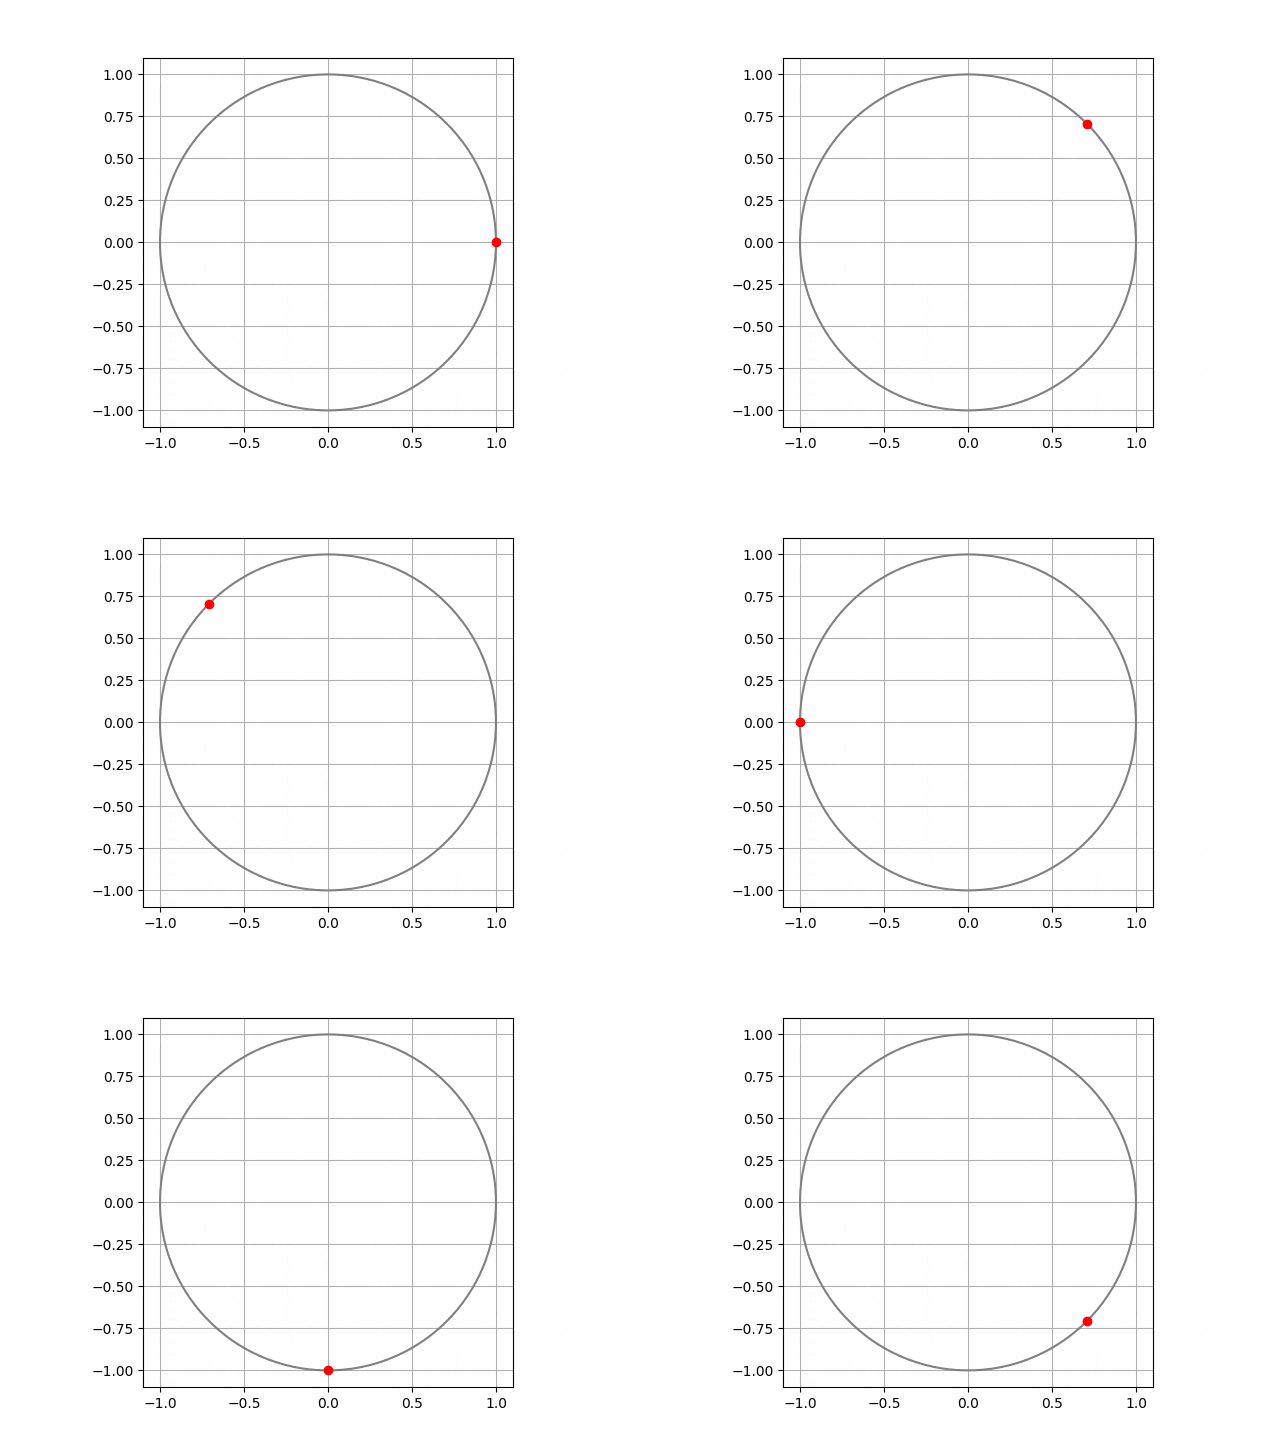
上の例ではすべての描画内容を各フレームで消去していましたが, 一部の Artist のみをクリアしたいということが往々にしてあると思います. 例えば次の例は単位円上を動く点 P のアニメーションですが, 毎回グリッドや単位円を描画していてなんだか無駄に見えます.
import numpy as np
import matplotlib.pyplot as plt
from matplotlib.animation import FuncAnimation

fig = plt.figure()
ax = fig.add_subplot(111, aspect=1)

theta = np.linspace(0, 2*np.pi, 128)

def update(f):
    ax.cla() # ax をクリア
    ax.grid()
    ax.plot(np.cos(theta), np.sin(theta), c="gray")
    ax.plot(np.cos(f), np.sin(f), "o", c="red")

anim = FuncAnimation(fig, update, frames=np.pi*np.arange(0,2,0.25), interval=200)

anim.save("c03.gif", writer="imagemagick")
plt.close()
この場合, すべてをクリアするのではなく, 消去したい Artist を明示的に remove すれば目的が達成できます.
import numpy as np
import matplotlib.pyplot as plt
from matplotlib.animation import FuncAnimation

fig = plt.figure()
ax = fig.add_subplot(111, aspect=1)

theta = np.linspace(0, 2*np.pi, 128)
p = []
ax.grid()
ax.plot(np.cos(theta), np.sin(theta), c="gray")

def update(f):
    if len(p) > 0:
        item = p.pop(0)
        ax.lines.remove(item)
    p.append( ax.plot([np.cos(f)], [np.sin(f)], "o", c="red")[0] )

anim = FuncAnimation(fig, update, frames=np.pi*np.arange(0,2,0.25), interval=200)

anim.save("c03.gif", writer="imagemagick")
plt.close()
もっとも, このふたつの例では描画速度の面ではどちらが有利なのか私にはよくわかりません. FuncAnimation の引数で blit=True と併用するのが良いように見えますが.
複数のサブプロットを持つアニメーション
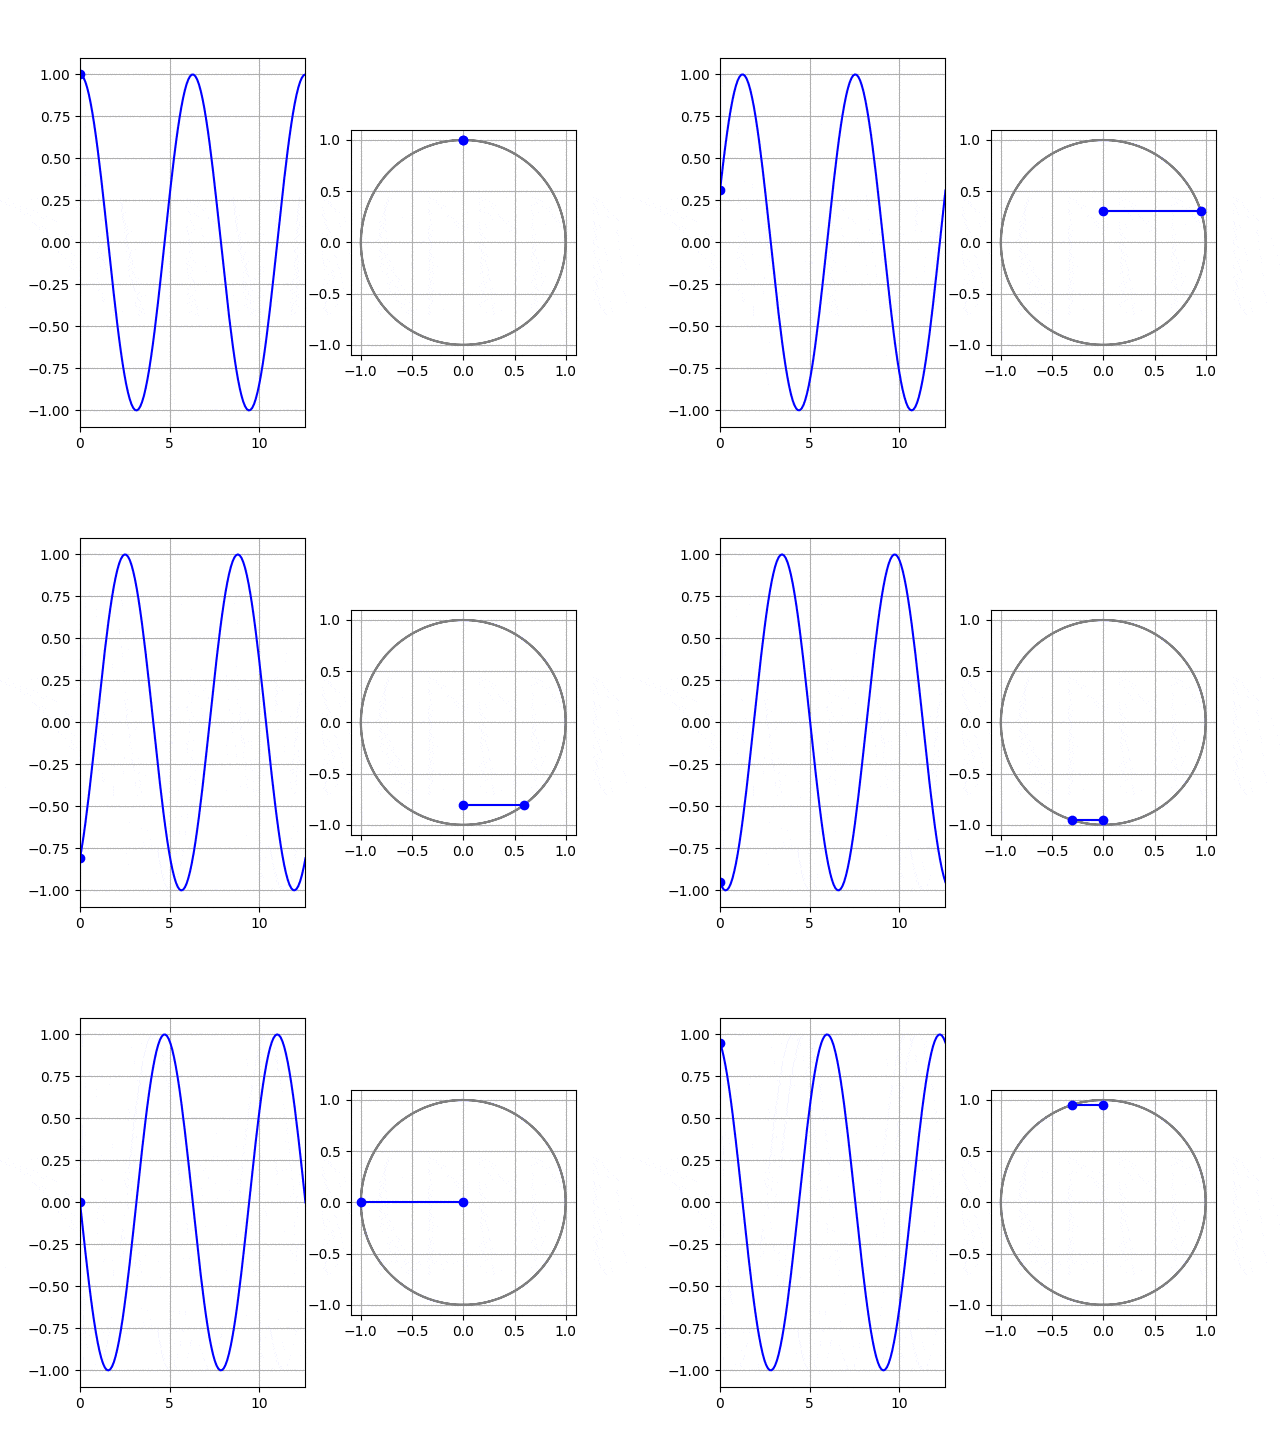
描画内容をクリアするために plt.cla() を使っていると, これは ax.cla() と同じ意味 (ax は直前に触っていた Axes) なので, 複数のサブプロットを持つアニメーションで表示内容をクリアし損ねるサブプロットが出てきてしまうことがあります. すべての Axes について ax.cla() しましょう.
import numpy as np
import matplotlib.pyplot as plt
from matplotlib.animation import FuncAnimation

fig = plt.figure()
axs = [
    fig.add_subplot(121),
    fig.add_subplot(122, aspect=1),
]
theta = np.linspace(0, 4*np.pi, 128)

def update(f):
    for ax in axs:
        ax.cla() # ax をクリア
        ax.grid()
    axs[0].set_xlim([0, 4*np.pi])
    axs[0].plot(theta, np.cos(theta - f), c="blue")
    axs[0].plot(0, np.cos(f), "o", c="blue")

    axs[1].plot(np.sin(theta), np.cos(theta), c="gray")
    axs[1].plot(np.sin(f), np.cos(f), "o", c="blue")
    axs[1].plot(0, np.cos(f), "o", c="blue")
    axs[1].plot([0, np.sin(f)], [np.cos(f), np.cos(f)], c="blue")

anim = FuncAnimation(fig, update, frames=np.pi*np.arange(0,2,0.1), interval=200)

anim.save("c04.gif", writer="imagemagick")
plt.close()


