CSVデータを収集する
まずは、CSVデータをとってきます。
何のデータを取ってこようか悩みましたが、
大好きなヨルシカの歌詞をスクレイピングして取ってきます。
まず、スクレイピングに必要なモジュールのインストール
pip install requests
pip install bs4
pip install lxml
pip install pandas
スクレイピング!
ここを参考にしました。
【https://qiita.com/yuuuusuke1997/items/122ca7597c909e73aad5#%E3%81%8A%E3%82%8F%E3%82%8A%E3%81%AB】
import requests
from bs4 import BeautifulSoup
import pandas as pd
import time

# スクレイピングしたデータを入れる表を作成
list_df = pd.DataFrame(columns=['歌詞'])

for page in range(10):
    try:
        #曲ページ先頭アドレス
        base_url = 'https://www.uta-net.com'

        #歌詞一覧ページ
        artist = "22653"
        url = 'https://www.uta-net.com/artist/'+artist+'/0/' + str(page) + '/'
        response = requests.get(url)
        soup = BeautifulSoup(response.text, 'lxml')
        links = soup.find_all('td', class_='side td1')
        for link in links:
            a = base_url + (link.a.get('href'))

            #歌詞詳細ページ
            response = requests.get(a)
            soup = BeautifulSoup(response.text, 'lxml')
            song_lyrics = soup.find('div', itemprop='lyrics')
            song_lyric = song_lyrics.text
            song_lyric = song_lyric.replace('\n','')
            #サーバーに負荷を与えないため1秒待機
            time.sleep(1)

            #取得した歌詞を表に追加
            tmp_se = pd.DataFrame([song_lyric], index=list_df.columns).T
            list_df = list_df.append(tmp_se)
    except:
        print(page)
        import traceback
        traceback.print_exc()

print(list_df)

# csv保存
list_df.to_csv('list.csv', mode = 'a', encoding='utf_8_sig')
形態素解析の必要なインストール
まずは必要なものをインストール
pip install "https://github.com/megagonlabs/ginza/releases/download/v1.0.2/ja_ginza_nopn-1.0.2.tgz"
pip install matplotlib
pip install wordcloud
matplotlibの日本語化
これを参考に【https://qiita.com/osakasho/items/7408d031ca0b2192422f 】
解析とグラフの表示!
# coding: utf-8
import spacy
nlp = spacy.load('ja_ginza_nopn')
import pandas as pd
import matplotlib.pyplot as plt
import collections
from wordcloud import WordCloud

def ginza(word):
    doc = nlp(word)
    # 調査結果
    total_ls = []
    Noun_ls = [chunk.text for chunk in doc.noun_chunks]
    Verm_ls = [token.lemma_ for token in doc if token.pos_ == "VERB"]
    for n in Noun_ls:
        total_ls.append(n)
    for v in Verm_ls:
        total_ls.append(v)
    return total_ls, Noun_ls, Verm_ls


"""---------------     CSV読み込みと前セット     --------------"""
csv_read_path = "list.csv"
df = pd.read_csv(csv_read_path)

target_categories = ["歌詞"]
black_list = ["test"]
"""-------------------------------------------------------------"""


"""---------------      形態素の処理  ------------------------"""
for target in target_categories:
    total_voc = []#文字を入れる箱を用意
    for data in df[target]:
        try:
            word_ls, noun_ls, verm_ls = ginza(data)
        except:#もし、分解できない場合は、一単語とする。
            word_ls = [data]
        for w in word_ls:
            if not w in black_list:#その単語がブラックリストに入っていないかチェックする。
                total_voc.append(w)

    print("単語数は、", len(total_voc), "でした。")

    # 最頻単語を順位づけ
    c = collections.Counter(total_voc)

    # CSVに書き込む
    c_data = (c.most_common())
    csvdf = pd.DataFrame(c_data)
    filename = target + ".csv"
    csvdf.to_csv(filename, encoding='utf_8_sig')
    print("----------------------------")

    # 一応グラフ化する
    # 追加部分 フォントを指定する。
    plt.rcParams["font.family"] = "IPAexGothic"
    plt.title(target)
    plt.grid(True)
    graph_x_list = []
    graph_y_list = []
    top_num = 0
    for key, value in c.most_common():
        graph_x_list.append(key)
        graph_y_list.append(value)
        if top_num >= 10:
            break
        top_num += 1
    try:
        plt.bar(graph_x_list, graph_y_list)
        # グラフの表示
        plt.show()
    except:
        print(target, " に関して、データを描画できませんでした。")

    # WordCloud で描画する
    font = 'C:/Windows/Fonts/YuGothM.ttc'
    wordcloud = WordCloud(background_color="white", width=1000, height=600, font_path=font)

    wordcloud.generate(" ".join(wordcloud_ls))
    wordcloud.to_file(target+'.png')

"""-------------------------------------------------------------"""
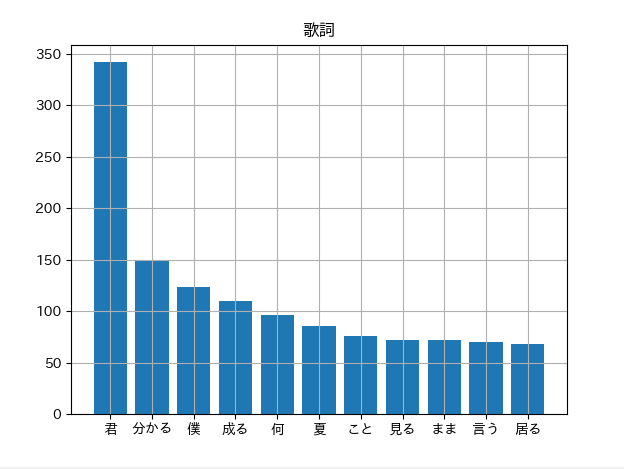
グラフの結果
棒グラフの結果
WordCloudの結果

めっちゃ分かってそうだね
お疲れ様でした。