前置き
pythonは最近機械学習関連で非常に活躍しているのは周知の事実だと思う
最近話題なのがdeeplearningとか
重たい処理を2万とか3万とかループしたりするので非常に時間がかかったりする
そんなシステムで1回の処理を1秒も減らせれば最終的な恩恵は計り知れないものになる
そういうことを目指して試行錯誤した結果をメモ程度に残しておく
このページではjoblibとかcythonとかは触れません
あくまでライブラリとか関係ないpythonの部分だけ
追記
numbaも試した
https://qiita.com/open_cans/items/b6cde6c28f8eacba0ca1
2020/10/17追記
初稿から3年経過しpythonのバージョンもだいぶ上がり、記事の情報も古くなってしまったのでpython3.9.0時点での情報に更新する。
1.while文はやめておけ!!!
ループをするときはfor文とかwhileとか使うと思う
ひとまず以下のコード実行速度を見て欲しい
from statistics import mean,stdev
from time import time

def while_loop():
    start = time()
    i=0
    sumation=0
    while(i<10**6):
        sumation += i
        i+=1
    elapsed_time = time() - start
    return elapsed_time

while_times = [while_loop() for i in range(10**3)]
from statistics import mean,stdev
from time import time

def for_loop():
    start = time()
    i=0
    sumation=0
    for i in range(10**6):
        sumation+=i
    elapsed_time = time() - start
    return elapsed_time

for_times = [for_loop() for i in range(10**3)]
mean_for = mean(for_times)
stdev_for = stdev(for_times)
print(f"forの平均値:{mean_for}")
print(f"forの標準偏差:{stdev_for}")
import pandas as pd
#処理結果をヒストグラムで表示
df = pd.DataFrame(zip(while_times, for_times), columns=["while", "for"])
df["while"].hist(bins=100,color="red")
df["for"].hist(bins=100,color="blue")
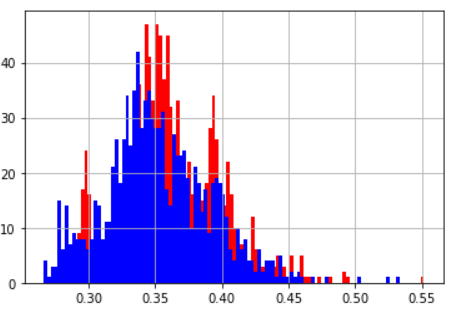
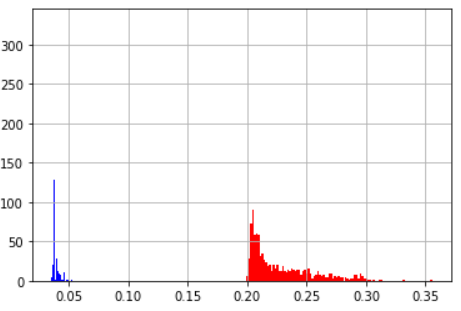
for、whileで100万回のループを行う関数を1000回行った
| 平均値 | 標準偏差 | |
|---|---|---|
| while | 0.069 | 0.0168 |
| for | 0.044 | 0.0097 |
ヒストグラム(青:for 赤:while)
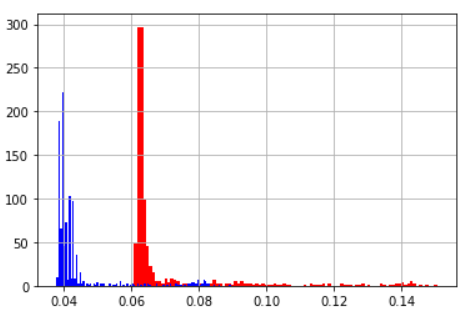
forもwhileもヒストグラムを見ると時間が延びる方向でブレが発生しているようだ。基本的にはforを使っておけば間違いなさそうである。
whileは遅い(断言)
2.for文の使い方に注意
2.1 参照の仕方に注意
例えば以下のようなリストがあったとする
from statistics import mean,stdev
from time import time

def index_ref():
    sumation=0
    temp=[1,2,3,4,5,6,7,8,9,10]
    start = time()
    for j in range(10**5):
        for i in range(10):
            sumation+=temp[i]
    return time() - start
index_ref_times = [index_ref() for i in range(10**3)]
mean_index_ref = mean(index_ref_times)
stdev_index_ref = stdev(index_ref_times)
print(f"index_refの平均値:{mean_index_ref}")
print(f"index_refの標準偏差:{stdev_index_ref}")
from statistics import mean,stdev
from time import time

def list_ref():
    sumation=0
    temp=[1,2,3,4,5,6,7,8,9,10]
    start = time()
    for j in range(10**5):
        for i in temp:
            sumation += i
    return time() - start

list_ref_times = [list_ref() for i in range(10**3)]
mean_list_ref = mean(list_ref_times)
stdev_list_ref = stdev(list_ref_times)
print(f"list_refの平均値:{mean_list_ref}")
print(f"list_refの標準偏差:{stdev_list_ref}")
import pandas as pd
df = pd.DataFrame(zip(list_ref_times, index_ref_times), columns=["list_ref", "index_ref"])
df["index_ref"].hist(bins=100,color="red")
df["list_ref"].hist(bins=100,color="blue")
| 平均値 | 標準偏差 | |
|---|---|---|
| インデックス指定して参照 | 0.077 | 0.0076 |
| リストから参照 | 0.041 | 0.0082 |
ヒストグラム(青:リストから参照 赤:インデックス指定して参)
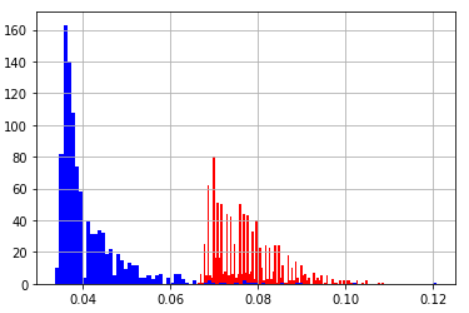
考えれば当然だけどインデックスで指定する方は毎回場所指定で参照しているので遅い
2.2 rangeに入れるなら一時変数
例えばこういうfor文
for i in range(len(IMAGE)):
    for i in range(len(IMAGE[0])):
一時変数を入れた時のものと比較してみよう
from statistics import mean,stdev
from time import time
import numpy as np
image = np.ones((1000,1000,3))

def everytime_calc_len():
    start = time()
    sumation=0
    for i in range(len(image)):
        for j in range(len(image[0])):
            sumation += i
    return time() - start

every_times = [everytime_calc_len() for i in range(10**3)]
mean_every = mean(every_times)
stdev_every = stdev(every_times)
print(f"毎回lenで計算する時の平均値:{mean_every}")
print(f"毎回lenで計算する時の標準偏差:{stdev_every}")
from statistics import mean,stdev
from time import time
import numpy as np
image = np.ones((1000,1000,3))

def onetime_calc_len():
    start = time()
    sumation=0
    for i in range(len(image)):
        for j in range(len(image[0])):
            sumation += i
    return time() - start

one_times = [onetime_calc_len() for i in range(10**3)]
mean_one = mean(one_times)
stdev_one = stdev(one_times)
print(f"一時変数で置き換えた時の平均値:{mean_one}")
print(f"一時変数で置き換えた時の標準偏差:{stdev_one}")
import pandas as pd
df = pd.DataFrame(zip(every_times, one_times), columns=["every", "one"])
df["every"].hist(bins=100,color="red")
df["one"].hist(bins=100,color="blue")
| 平均値 | 標準偏差 | |
|---|---|---|
| 毎回lenで計算 | 0.044 | 0.0074 |
| 一時変数に置き換える | 0.044 | 0.0069 |
ヒストグラム(青:一時変数 赤:毎回lenで計算)
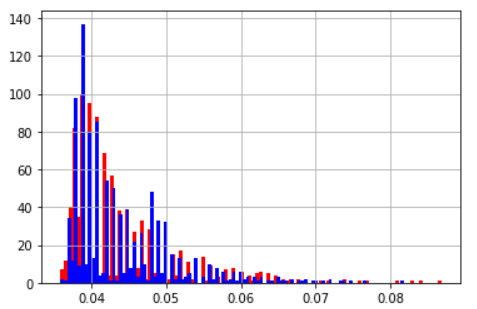
len程度だと誤差なのでお好きな方をお使いください
改善幅は軽微に見えるかもしれないが1000*1000のループで0.01秒も違うと最終的に結構違うので大事にしてほしい
2.3リストを作るなら内包表記にしよう!
[y,x]のリストを作ることを考えよう。この時for文と内包表記で作成して速度差を計測する。
2.3.1 基本的な内包表記
from statistics import mean,stdev
from time import time

def for_loop():
    start = time()
    list1=[]
    for y in range(1000):
        for x in range(1000):
            list1.append([y,x])
    return time() - start

for_loop_times = [for_loop() for i in range(10**3)]
mean_for_loop = mean(for_loop_times)
stdev_for_loop = stdev(for_loop_times)
print(f"二重for文の平均値:{mean_for_loop}")
print(f"二重for文の標準偏差:{stdev_for_loop}")
from statistics import mean,stdev
from time import time

def naihou():
    start = time()
    list1 = [[y,x] for y in range(1000) for x in range(1000) ]
    return time() - start

naihou_times = [naihou() for i in range(10**3)]
mean_naihou = mean(naihou_times)
stdev_naihou = stdev(naihou_times)
print(f"内包表記の平均値:{mean_naihou}")
print(f"内包表記の標準偏差:{stdev_naihou}")
import pandas as pd
df = pd.DataFrame(zip(for_loop_times, naihou_times), columns=["for", "naihou"])
df["for"].hist(bins=100,color="red")
df["naihou"].hist(bins=100, color="blue")
| 平均値 | 標準偏差 | |
|---|---|---|
| 2重for文 | 0.387 | 0.024 |
| 内包表記 | 0.337 | 0.0201 |
ヒストグラム(青:内包表記 赤:2重for文)
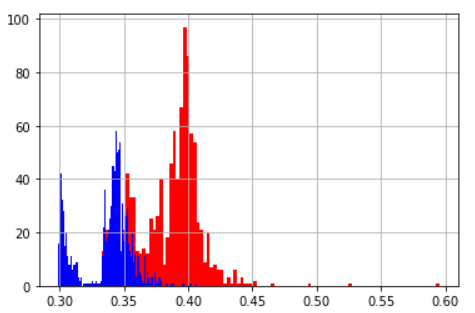
基本的に内包表記のほうが早い
2.3.2 if文がはいるとどうなるの?
from statistics import mean,stdev
from time import time

def for_loop():
    start = time()
    list1=[]
    for y in range(1000):
        for x in range(1000):
            if (y+x)%2==0:
                list1.append([y,x])
    return time() - start

for_loop_times = [for_loop() for i in range(10**3)]
mean_for_loop = mean(for_loop_times)
stdev_for_loop = stdev(for_loop_times)
print(f"二重for文の平均値:{mean_for_loop}")
print(f"二重for文の標準偏差:{stdev_for_loop}")
from statistics import mean,stdev
from time import time

def naihou():
    start = time()
    list1 = [[y,x] for y in range(1000) for x in range(1000) if (y+x)%2==0]
    return time() - start

naihou_times = [naihou() for i in range(10**3)]
mean_naihou = mean(naihou_times)
stdev_naihou = stdev(naihou_times)
print(f"内包表記の平均値:{mean_naihou}")
print(f"内包表記の標準偏差:{stdev_naihou}")
import pandas as pd
df = pd.DataFrame(zip(for_loop_times, naihou_times), columns=["for", "naihou"])
df["for"].hist(bins=100,color="red")
df["naihou"].hist(bins=100, color="blue")
| 平均値 | 標準偏差 | |
|---|---|---|
| 2重for文 | 0.387 | 0.024 |
| 内包表記 | 0.337 | 0.0201 |
ヒストグラム(青:内包表記 赤:2重for文)
for文の中にif文が入ると処理速度がトントンぐらいになるようだ
お好きな方をご使用ください。
3.if文の条件式にも注意
とりあえずこれを見ていただきたい
from statistics import mean,stdev
from time import time

def if_and1():
    start = time()
    sumation=0
    for i in range(2*10**3):
        if i%(i**i)==0 and i%2==0:
            sumation+=i
    return time() - start

if_and1_times = [if_and1() for i in range(10**3)]
mean_if_and1 = mean(if_and1_times)
stdev_if_and1 = stdev(if_and1_times)
print(f"処理重い項が先の平均値:{mean_if_and1}")
print(f"処理重い項が先の標準偏差:{stdev_if_and1}")
from statistics import mean,stdev
from time import time

def if_and2():
    start = time()
    sumation=0
    for i in range(2*10**3):
        if i%2==0 and i%(i**i)==0:
            sumation+=i
    return time() - start

if_and2_times = [if_and2() for i in range(10**3)]
mean_if_and2 = mean(if_and2_times)
stdev_if_and2 = stdev(if_and2_times)
print(f"処理重い項が後の平均値:{mean_if_and2}")
print(f"処理重い項が後の標準偏差:{stdev_if_and2}")
import pandas as pd
df = pd.DataFrame(zip(if_and1_times, if_and2_times), columns=["and1", "and2"])
df["and1"].hist(bins=100,color="red")
df["and2"].hist(bins=100, color="blue")
| 平均値 | 標準偏差 | |
|---|---|---|
| 処理重い項が先 | 0.046 | 0.0034 |
| 処理重い項が後 | 0.023 | 0.0029 |
ヒストグラム(青:処理重い項が後 赤:処理重い項が先)
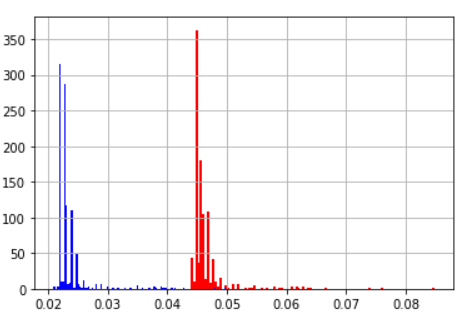
ここからわかることはif文の条件式の順番が違うだけで速度に差が出るということ
and条件の時は項が複数あっても1つFalseになれば結果は同じなので最初の項でFalseなら後は見ないということかもしれない
3.2 and条件をor条件に変えてみる
例えば not(A and B) みたいな条件式は not(A) or not(B)で置き換えることができる(ド・モルガンの法則)
not(A and B)
not(A) or not(B)
どちらが速くなるのだろうか
from statistics import mean,stdev
from time import time

def if_and1():
    start = time()
    sumation=0
    for i in range(3*10**3):
        if not(i%(500**i)==0 and i%(600**i)==0):
            sumation+=i
    return time() - start

if_and1_times = [if_and1() for i in range(10**3)]
mean_if_and1 = mean(if_and1_times)
stdev_if_and1 = stdev(if_and1_times)
print(f"and1の平均値:{mean_if_and1}")
print(f"and1の標準偏差:{stdev_if_and1}")
from statistics import mean,stdev
from time import time

def if_and2():
    start = time()
    sumation=0
    for i in range(3*10**3):
        if not(i%(500**i)==0) or not(i%(600**i)==0):
            sumation+=i
    return time() - start

if_and2_times = [if_and2() for i in range(10**3)]
mean_if_and2 = mean(if_and2_times)
stdev_if_and2 = stdev(if_and2_times)
print(f"and2の平均値:{mean_if_and2}")
print(f"and2の標準偏差:{stdev_if_and2}")
| 平均値 | 標準偏差 | |
|---|---|---|
| notが1つ | 0.104 | 0.0028 |
| notが2つ | 0.104 | 0.0033 |
ヒストグラム(青:notが2つ 赤:notが1つ)
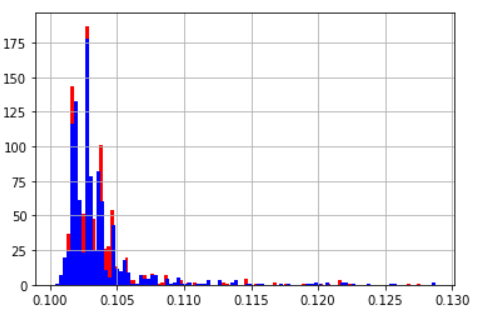
なんか下の方が重い
もしかしてnotで遅くなっているのではないかと両者のnotの数を1にして計測
誤差
4.mapを使おう!!
A = '010'
num = int(A)
みたいな感じで変数を変換することがあると思う
こういうときはmapを使うと早くなる
from statistics import mean,stdev
from time import time

def for_cast():
    image = [1.1 for i in range(10**5)]
    sumation=0
    length = len(image)
    start = time()
    for i in range(length):
        image[i] = int(image[i])
    return time() - start

for_cast_times = [for_cast() for i in range(10**3)]
mean_for_cast = mean(for_cast_times)
stdev_for_cast = stdev(for_cast_times)
print(f"for_castの平均値:{mean_for_cast}")
print(f"for_castの標準偏差:{stdev_for_cast}")
from statistics import mean,stdev
from time import time

def map_cast():
    image = [1.1 for i in range(10**5)]
    start = time()
    image = list(map(int,image))
    return time() - start

map_cast_times = [map_cast() for i in range(10**3)]
mean_map_cast = mean(map_cast_times)
stdev_map_cast = stdev(map_cast_times)
print(f"_map_castの平均値:{mean_map_cast}")
print(f"_map_castの標準偏差:{stdev_map_cast}")
import pandas as pd
df = pd.DataFrame(zip(for_cast_times, map_cast_times), columns=["for_cast", "map_cast"])
df["for_cast"].hist(bins=100,color="red")
df["map_cast"].hist(bins=100, color="blue")
| 平均値 | 標準偏差 | |
|---|---|---|
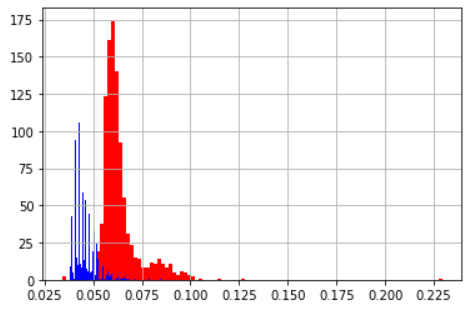
| for_cast | 0.015 | 0.003 |
| map_cast | 0.007 | 0.0011 |
ヒストグラム(青:mapでcast 赤:forでcast)
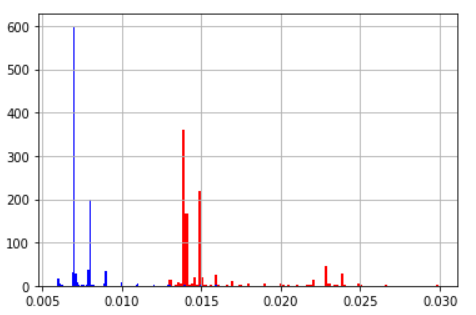
mapを使おう!
4.1 numpy.float32の配列にはmapを使うな!!
上記でmapは基本的に早いと説明したがpythonの実装ミスなのかnumpyの実装ミスなのかnumpy.float32にmapを適用しようとすると遅い。
いっそnumpy.float64に変換した方が良いほどだ
from statistics import mean,stdev
from time import time
import numpy as np

def np_float32():
    check = np.arange(0.000001, 0.1, 0.000001) #生成されるデータはnumpy.float64型
    change = check.astype(np.float32)

    start=time()
    list(map(lambda x :x-1, change ))
    return time()-start

np_float32_times = [np_float32() for i in range(10**3)]
mean_np_float32 = mean(np_float32_times)
stdev_np_float32 = stdev(np_float32_times)
print(f"np_float32の平均値:{mean_np_float32}")
print(f"np_float32の標準偏差:{stdev_np_float32}")
from statistics import mean,stdev
from time import time
import numpy as np

def np_float64():
    check = np.arange(0.000001, 0.1, 0.000001)
    start=time()
    list(map(lambda x :x-1, check))
    return time()-start

np_float64_times = [np_float64() for i in range(10**3)]
mean_np_float64 = mean(np_float64_times)
stdev_np_float64 = stdev(np_float64_times)
print(f"np_float64の平均値:{mean_np_float64}")
print(f"np_float64の標準偏差:{stdev_np_float64}")
np.arangeの出力はnumpy.float64型である。この時の実行速度は
| 平均値 | 標準偏差 | |
|---|---|---|
| np_float32 | 0.228 | 0.0269 |
| np_float64 | 0.039 | 0.0039 |
ヒストグラム(青:np_float64 赤:np_float32)
となる。以下にnumpy.float32をnumpy.float64に変換してmapをかけ、numpy.float32に変換した場合の処理を示す。
この場合でもnumpy.float32をそのままmapを使うよりは早い
import numpy as np
from time import time

check = np.arange(0.000001, 0.1, 0.000001)
change = check.astype(np.float32)

start=time()
convert = change.astype(np.float64)
temp = np.asarray(list(map(lambda x :x-1, convert)))
convert = temp.astype(np.float32)
convert = list(convert)
time()-start
| 平均値 | 標準偏差 | |
|---|---|---|
| np_float32 | 0.228 | 0.0269 |
| np_float64 | 0.039 | 0.0039 |
| np_float64→np_float32 | 0.047 | 0.0068 |
ヒストグラム(青:np_float64 赤:np_float32, 緑:np_float64→np_float32)
分かりにくいが0.049付近の緑が
numpy.float32 → map → numpy.float64 → listの順で実行したものである
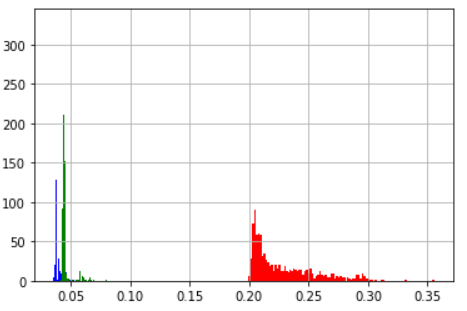
もはや意味が分からない。なお基本的な計算はnumpy.float32の方が早い。numpyのバージョンは1.18.5
5.tupleを使おう!
例えば逐次処理されるデータをlistにまとめてpandasに変換して最終結果を出力・・・というような処理の場合はtupleを使うと良い。
from statistics import mean,stdev
from time import time
import numpy as np

def list_object_append():
    random_list=np.random.rand(10**7)

    start=time()
    list_test=[ [i,i] for i in random_list]
    b=pd.DataFrame(list_test)
    return time()-start

list_object_append_times = [list_object_append() for i in range(10**3)]
mean_list_object_append = mean(list_object_append_times)
stdev_list_object_append = stdev(list_object_append_times)
print(f"list_object_appendの平均値:{mean_list_object_append}")
print(f"list_object_appendの標準偏差:{stdev_list_object_append}")
from statistics import mean,stdev
from time import time
import numpy as np

def tuple_object_append():
    random_list=np.random.rand(10**7)

    start=time()
    tuple_test=((i,i) for i in random_list)
    a=pd.DataFrame(tuple_test)
    return time()-start

tuple_object_append_times = [tuple_object_append() for i in range(10**3)]
mean_tuple_object_append = mean(tuple_object_append_times)
stdev_tuple_object_append = stdev(tuple_object_append_times)
print(f"tuple_object_appendの平均値:{mean_tuple_object_append}")
print(f"tuple_object_appendの標準偏差:{stdev_tuple_object_append}")
| 平均値 | 標準偏差 | |
|---|---|---|
| listをappend | 0.064 | 0.0109 |
| tupleをappend | 0.045 | 0.0054 |
ヒストグラム(青:tupleをappend 赤:listをappend)
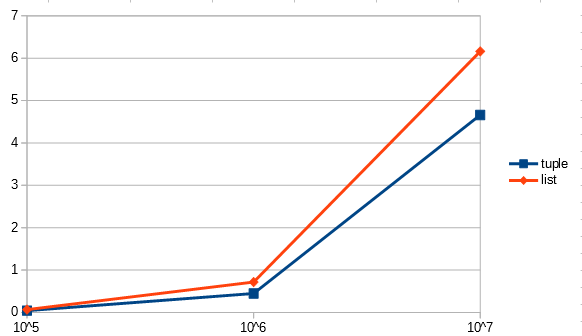
何割か縮めることができる。配列のサイズによっても変わってくるのでグラフにする。
横軸は配列のサイズ、縦軸は処理時間の100回平均
| 配列のサイズ | tuple | list |
|---|---|---|
| 10^5 | 0.042 | 0.067 |
| 10^6 | 0.447 | 0.717 |
| 10^7 | 4.661 | 6.162 |
まとめ
・whileは使わない
・リスト作るときにfor文使うなら内包表記を使おう
・if文の条件式を見直そう
・mapを使おう
・appendが必要な時にtupleが使えるなら使おう!
if文とかマイクロ秒レベルの話になってしまったけれどきっと誰かの役に立つと信じて