新しくレポート書くとき、以前書いたレポートのプリアンブルを丸ごとコピぺして、コマンドの使い方をいちいち調べながら書いてます。めんどくさいのでよく使うやつはまとめとこうと思いました。
「これどうやるんだろ?」って思って調べると大体この辺のサイトが出てきます。助かってます。
あとTeX - LaTeX Stack Exchangeは、ググっても解決しなかったときにここで検索して助けてもらってます。英語の勉強にもなる。
普段はCloud LaTeXを利用しています。コンパイルもPDF出力もボタン一つでやってくれます。めっちゃ楽。
文書クラス、タイトル
ここはいつも完全にコピペ。
\documentclass[a4j]{jsarticle}

\title{タイトル}
\author{著者}
\date{日付}

\begin{document}
\maketitle

\end{document}
\documentclassは文書の種類を指定するもので、{jsarticle}は和文論文の意味らしいです。[a4j]は用紙サイズをa4サイズにするオプションです。文字サイズとかもここで変えられます。
図の挿入
基本
画像を挿入するときのテンプレート
\usepackage[dvipdfmx]{graphicx}

\begin{document}

\begin{figure}[htbp]
  \centering
  \includegraphics[オプション]{図のファイル名}
  \caption{図のキャプション}
\end{figure}

\end{document}
オプションの部分では(大体)図の大きさを指定します。[width=100mm]とか[scale=1.5]とか。
複数枚を横並びに
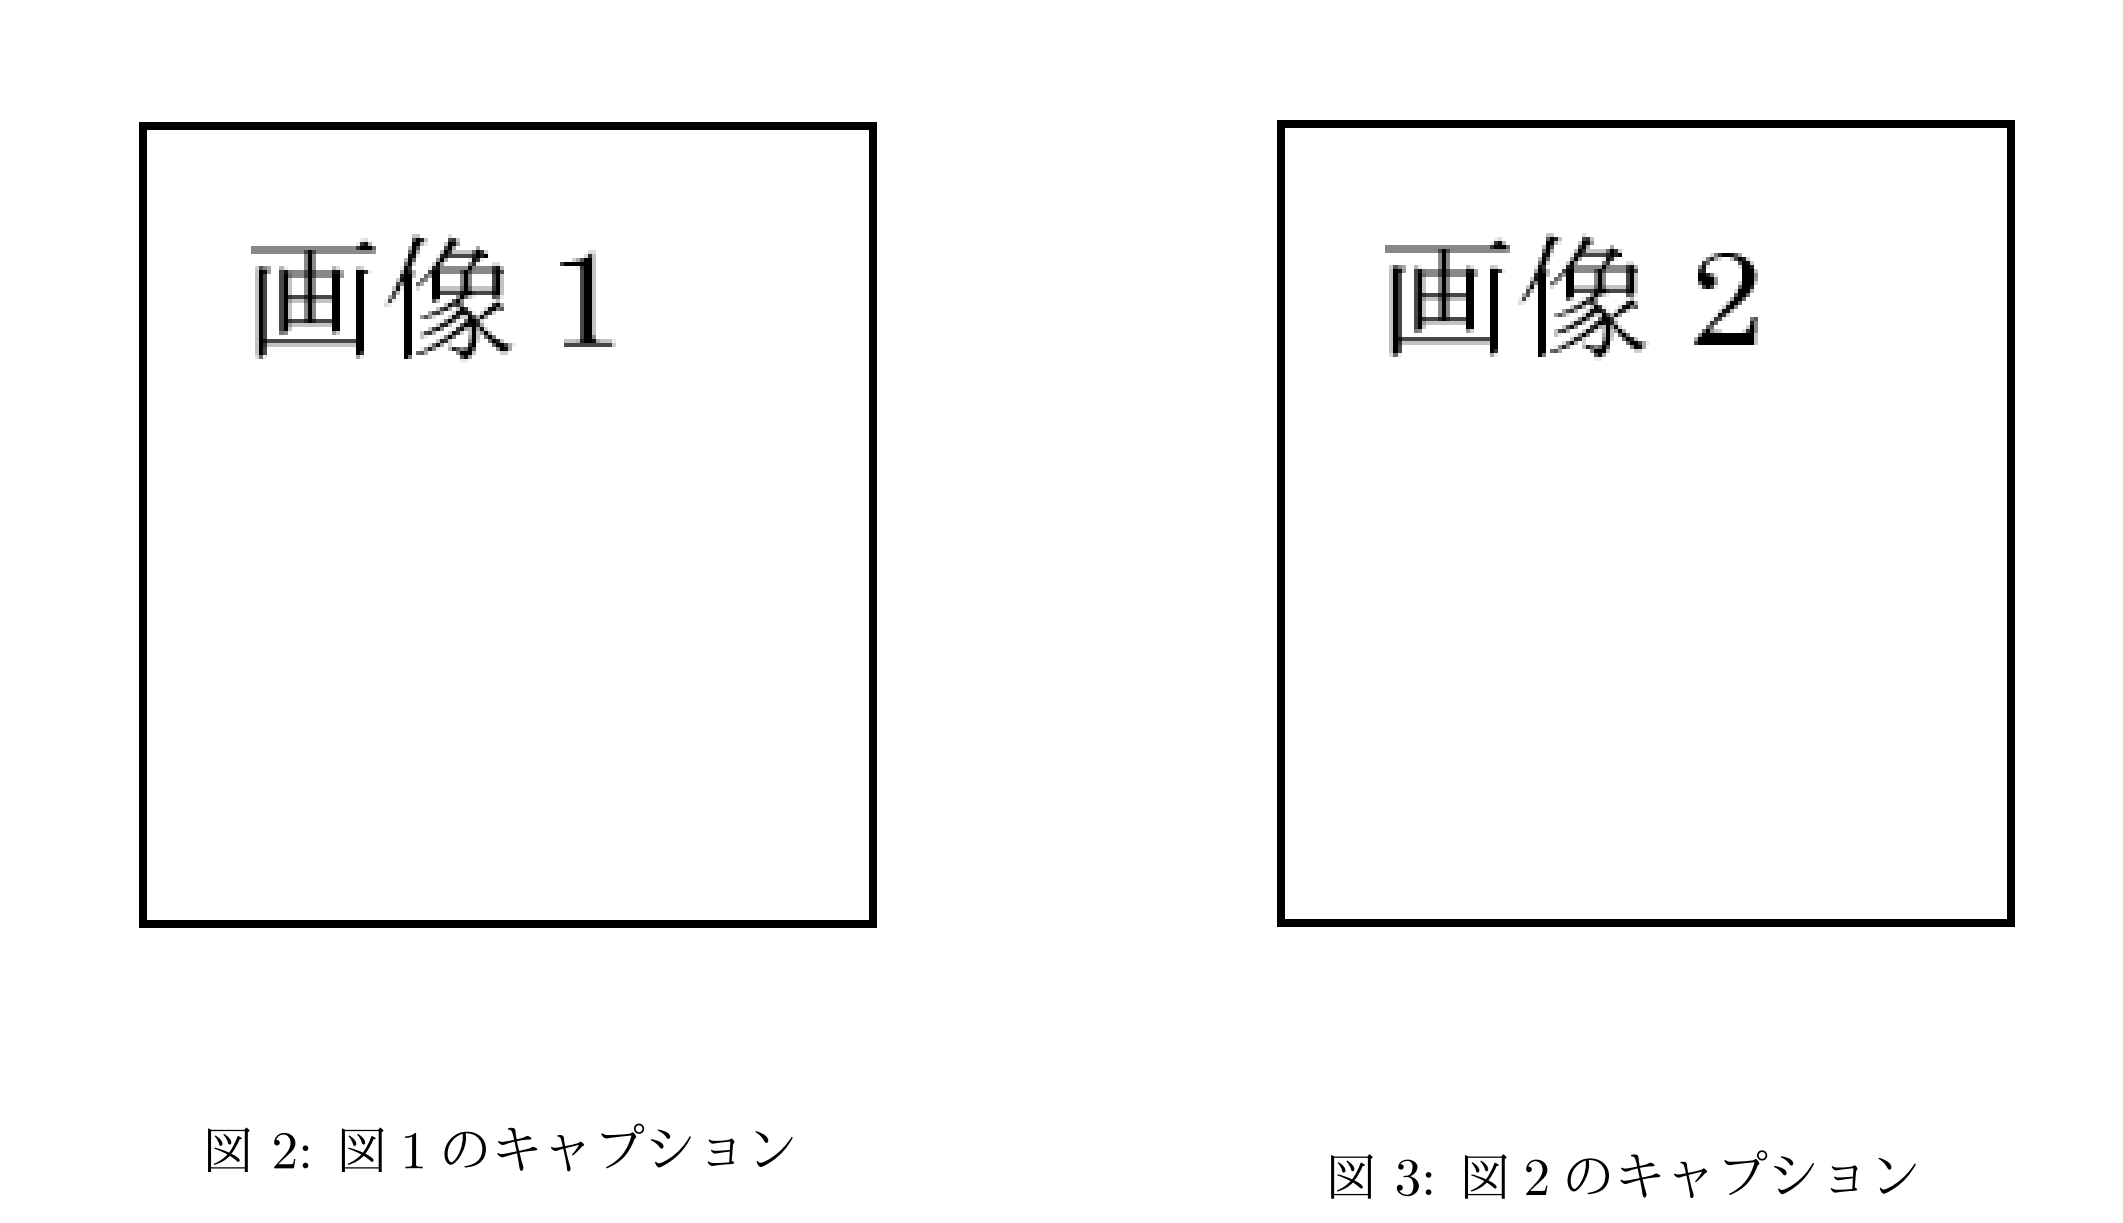
2枚の画像を横並びに配置したいときのテンプレート。同様に3枚以上でもできます。
\usepackage[dvipdfmx]{graphicx}

\begin{document}

\begin{figure}[htbp]
 \begin{minipage}{0.5\hsize}
  \centering
  \includegraphics[オプション]{図1のファイル名}
  \caption{図1のキャプション}
 \end{minipage}
 \begin{minipage}{0.5\hsize}
  \centering
  \includegraphics[オプション]{図2のファイル名}
  \caption{図2のキャプション}
 \end{minipage}
\end{figure}

\end{document}
minipage環境ってやつを使ってます。\begin{minipage}{0.5\hsize}の0.5を0.33にしたら3枚の図を並べられます。
2枚だとこんな感じの出力になります。(キャプションの図番号が図2と図3になってますが、この上にも一枚図が配置されているだけなので気にしないで)
状態遷移図
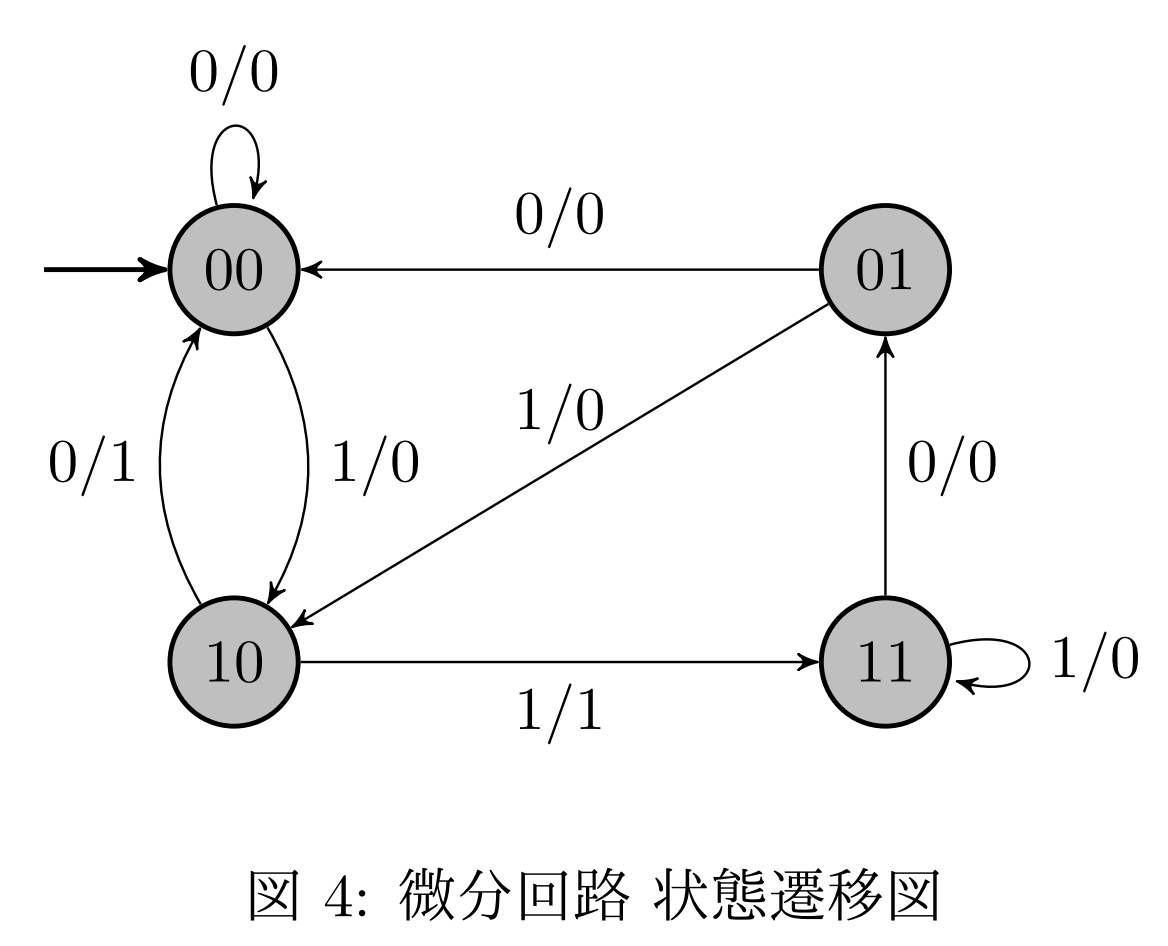
Finite State Machine Designerは、簡単なマウス操作で状態遷移図を作れて、それをPNG/SVG/LaTeXの形式でエクスポートできるサイトです。
普段コピペしているコードは、日本語で書かれたサイトに載ってたものをいただいた記憶がありますがどのサイトかは思い出せず、見つけられず、、ゴメンナサイ。
状態遷移図を描くときのテンプレート。
\usepackage{tikz}

\usetikzlibrary{arrows,shapes,automata,petri,positioning,calc}

%tikzsetはなくても大丈夫です
\tikzset{
    place/.style={
        circle,
        thick,
        draw=black,
        fill=gray!50,
        minimum size=6mm,
    },
        state/.style={
        circle,
        thick,
        draw=blue!75,
        fill=blue!20,
        minimum size=6mm,
    },
}

\begin{document}

\begin{figure}[!h]
\centering
\begin{tikzpicture}[node distance=3cm and 3cm,>=stealth',auto, every lace/.style={draw}]
    \node [place] (S1) {00};
    \coordinate[node distance=1.1cm,left of=S1] (left-S1);
    \coordinate[node distance=1.1cm,right of=S1] (right-S1);
    \draw[->, thick] (left-S1) -- (S1);

    \node [place] (S2) [right=of S1] {01};
    \node [place] (S3) [node distance=1.5cm,below =of S1] {10};
    \node [place] (S4) [right=of S3] {11};

    \path[->] (S1) edge [loop above] node {0/0} ();
    \path[->] (S1) edge [bend left] node {1/0} (S3);
    \path[->] (S2) edge [above] node {0/0} (S1);
    \path[->] (S2) edge [above] node {1/0} (S3);
    \path[->] (S3) edge [bend left] node {0/1} (S1);
    \path[->] (S3) edge [below] node {1/1} (S4);
    \path[->] (S4) edge [right] node {0/0} (S2);
    \path[->] (S4) edge [loop right] node {1/0} ();
\end{tikzpicture}
\caption{微分回路 状態遷移図}
\end{figure}

\end{document}
以前のレポートからそのまま持ってきました。微分回路の状態遷移図です。微分回路の状態遷移図として正しいかは置いておいて、上のコードの出力が次の画像です。
\tikzsetは、状態の色とかを設定しているだけなので、無くても大丈夫です。
調べたら解説もつけてくれているサイトありました。
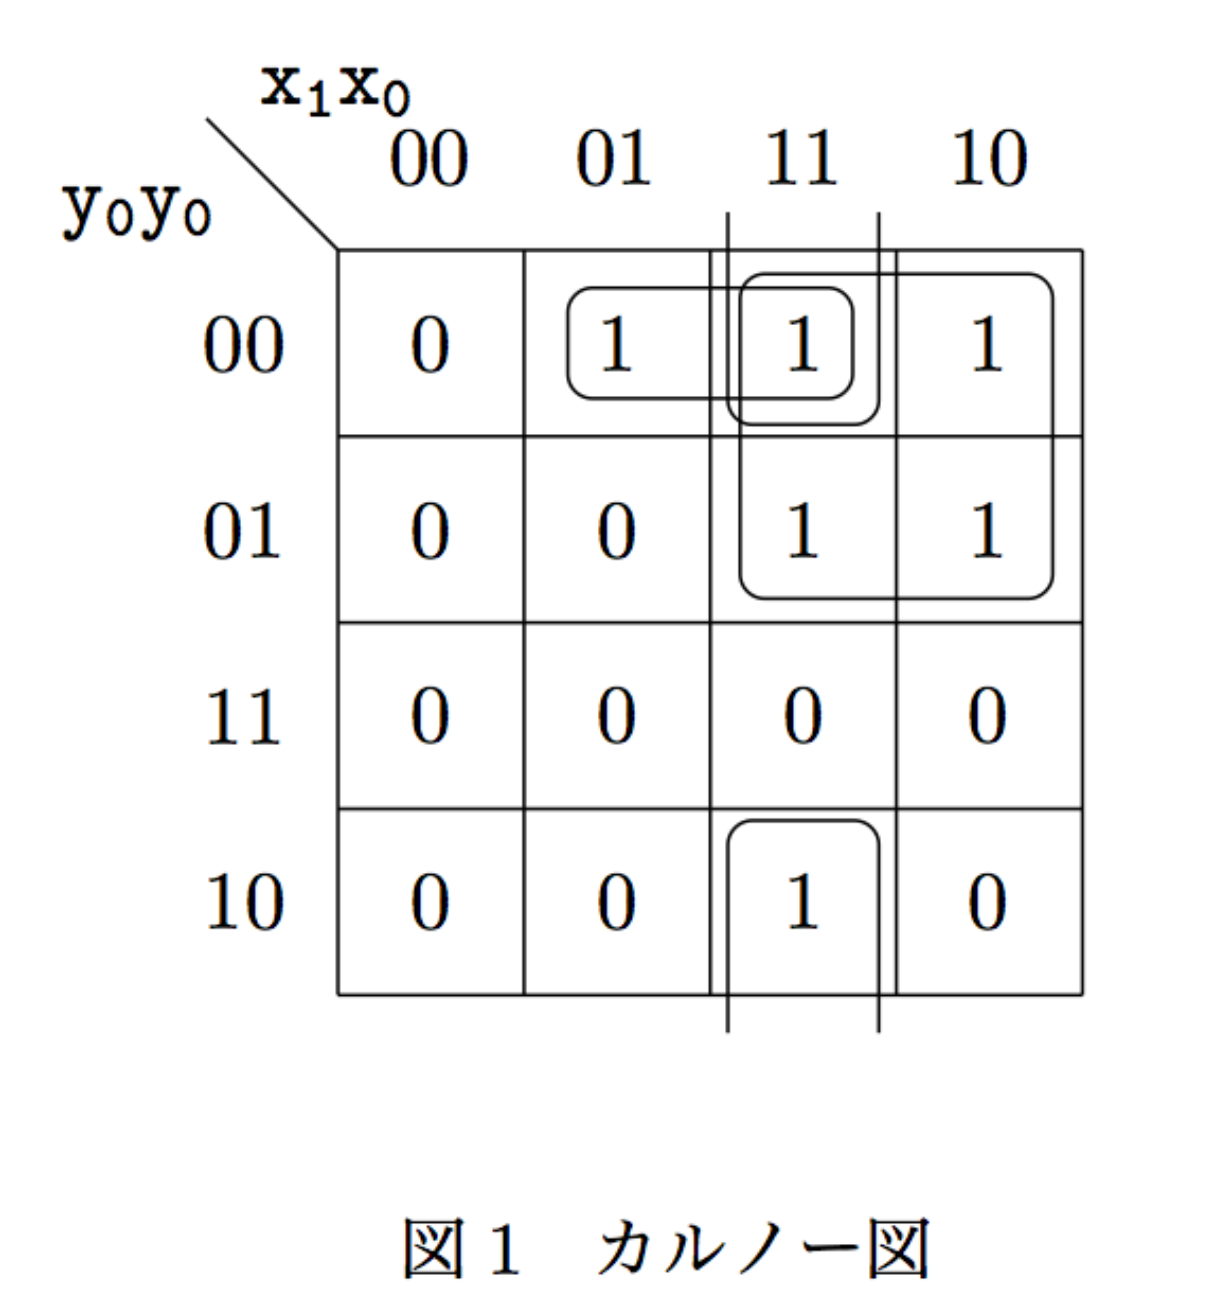
カルノー図
論理回路のレポートで使いました。
こちらを参考に、というかなんも考えずにコピペして使っています。
\documentclass[a4j,dvipdfmx]{jarticle}
\usepackage{graphicx}
\usepackage{tikz}
\usepackage{amssymb}
\usetikzlibrary{matrix,calc}

\newcommand{\implicant}[3][0]{
    \draw[rounded corners=3pt] ($(#2.north west)+(135:#1)$) rectangle ($(#3.south east)+(-45:#1)$);
    }

\newcommand{\implicantcostats}[3][0]{
    \draw[rounded corners=3pt] ($(rf.east |- #2.north)+(90:#1)$)-| ($(#2.east)+(0:#1)$) |- ($(rf.east |- #3.south)+(-90:#1)$);
    \draw[rounded corners=3pt] ($(cf.west |- #2.north)+(90:#1)$) -| ($(#3.west)+(180:#1)$) |- ($(cf.west |- #3.south)+(-90:#1)$);
}

\newcommand{\implicantdaltbaix}[3][0]{
    \draw[rounded corners=3pt] ($(cf.south -| #2.west)+(180:#1)$) |- ($(#2.south)+(-90:#1)$) -| ($(cf.south -| #3.east)+(0:#1)$);
    \draw[rounded corners=3pt] ($(rf.north -| #2.west)+(180:#1)$) |- ($(#3.north)+(90:#1)$) -| ($(rf.north -| #3.east)+(0:#1)$);
}

\newcommand{\implicantcantons}[1][0]{
    \draw[rounded corners=3pt] ($(rf.east |- 0.south)+(-90:#1)$) -| ($(0.east |- cf.south)+(0:#1)$);
    \draw[rounded corners=3pt] ($(rf.east |- 8.north)+(90:#1)$) -| ($(8.east |- rf.north)+(0:#1)$);
    \draw[rounded corners=3pt] ($(cf.west |- 2.south)+(-90:#1)$) -| ($(2.west |- cf.south)+(180:#1)$);
    \draw[rounded corners=3pt] ($(cf.west |- 10.north)+(90:#1)$) -| ($(10.west |- rf.north)+(180:#1)$);
}

\newenvironment{Karnaugh}[2]%
{
\begin{tikzpicture}[baseline=(current bounding box.north),scale=0.8]
\draw (0,0) grid (4,4);
\draw (0,4) -- node [pos=0.8,above right,anchor=south west] {#1} node [pos=0.7,below left,anchor=north east] {#2} ++(135:1);
%
\matrix (mapa) [matrix of nodes,
        column sep={0.8cm,between origins},
        row sep={0.8cm,between origins},
        every node/.style={minimum size=0.3mm},
        anchor=8.center,
        ampersand replacement=\&] at (3.5,3.5)
{
                       \& |(c00)| 00         \& |(c01)| 01         \& |(c11)| 11         \& |(c10)| 10         \& |(cf)| \phantom{00} \\
|(r00)| 00             \& |(0)|  \phantom{0} \& |(4)|  \phantom{0} \& |(12)| \phantom{0} \& |(8)|  \phantom{0} \&                     \\
|(r01)| 01             \& |(1)|  \phantom{0} \& |(5)|  \phantom{0} \& |(13)| \phantom{0} \& |(9)|  \phantom{0} \&                     \\
|(r11)| 11             \& |(3)|  \phantom{0} \& |(7)|  \phantom{0} \& |(15)| \phantom{0} \& |(11)| \phantom{0} \&                     \\
|(r10)| 10             \& |(2)|  \phantom{0} \& |(6)|  \phantom{0} \& |(14)| \phantom{0} \& |(10)| \phantom{0} \&                     \\
|(rf) | \phantom{00}   \&                    \&                    \&                    \&                    \&                     \\
};
}%
{
\end{tikzpicture}
}

\newenvironment{Karnaughvuit}[2]%
{
\begin{tikzpicture}[baseline=(current bounding box.north),scale=0.8]
\draw (0,0) grid (4,2);
\draw (0,2) -- node [pos=0.7,above right,anchor=south west] {#1} node [pos=0.7,below left,anchor=north east] {#2} ++(135:1);
%
\matrix (mapa) [matrix of nodes,
        column sep={0.8cm,between origins},
        row sep={0.8cm,between origins},
        every node/.style={minimum size=0.3mm},
        anchor=4.center,
        ampersand replacement=\&] at (3.5,1.5)
{
                      \& |(c00)| 00         \& |(c01)| 01         \& |(c11)| 11         \& |(c10)| 10         \& |(cf)| \phantom{00} \\
|(r00)| 0             \& |(0)|  \phantom{0} \& |(2)|  \phantom{0} \& |(6)|  \phantom{0} \& |(4)|  \phantom{0} \&                     \\
|(r01)| 1             \& |(1)|  \phantom{0} \& |(3)|  \phantom{0} \& |(7)|  \phantom{0} \& |(5)|  \phantom{0} \&                     \\
|(rf) | \phantom{00}  \&                    \&                    \&                    \&                    \&                     \\
};
}%
{
\end{tikzpicture}
}

\newcommand{\contingut}[1]{%
\foreach \x [count=\xi from 0] in {#1}
     \path (\xi) node {\x};
}

\begin{document}

\begin{center}
  \begin{figure}
    \centering
    \begin{Karnaugh}{$\tt{x_1 x_0}$}{$\tt{y_0 y_0}$}
      \contingut{0,0,0,0,1,0,0,0,1,1,0,0,1,1,1,0}
      \implicant{4}{12}
      \implicant[3pt]{12}{9}
      \implicantdaltbaix[4pt]{12}{14}
    \end{Karnaugh}
    \caption{カルノー図}
  \end{figure}
\end{center}

\end{document}
このコードで、次の出力ができます。
注意事項とか、先述のサイトに載っているので、なんかあったらそっちを見てください。上に上げた出力例もすべてお借りしたものです。
表の挿入
基本
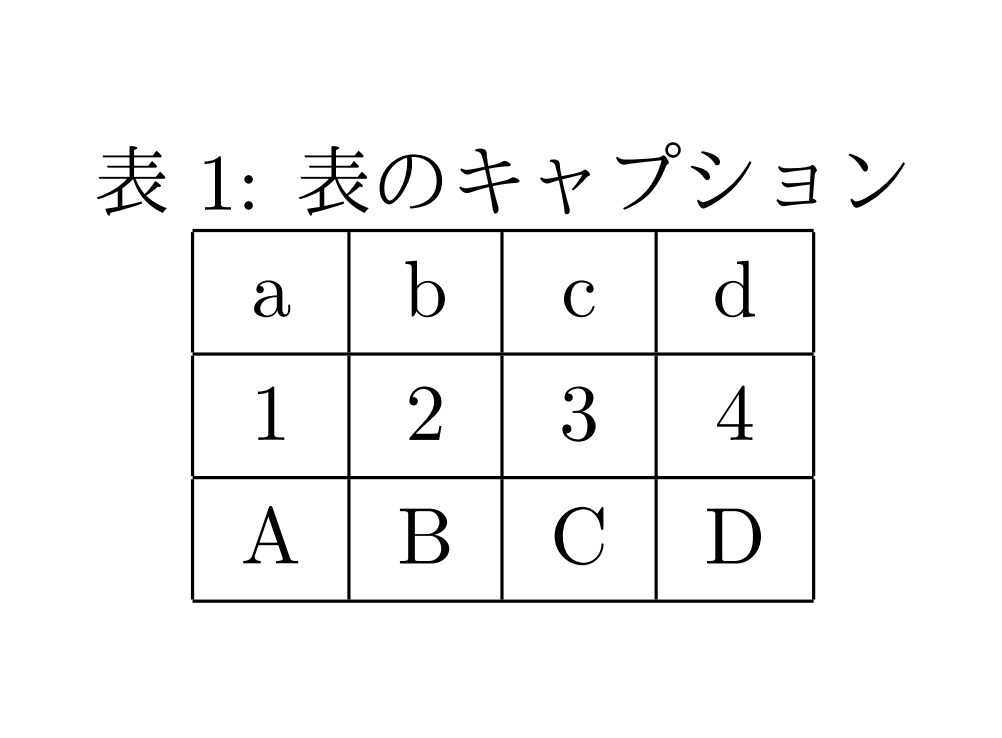
表を出力するテンプレート
\begin{document}

\begin{table}[htbp]
 \centering
 \caption{表のキャプション}
 \begin{tabular}{|c|c|c|c|}
  \hline
  a & b & c & d \\ \hline
  1 & 2 & 3 & 4 \\ \hline
  A & B & C & D \\ \hline
 \end{tabular}
\end{table}

\end{document}
出力が次の画像です。
セルの結合
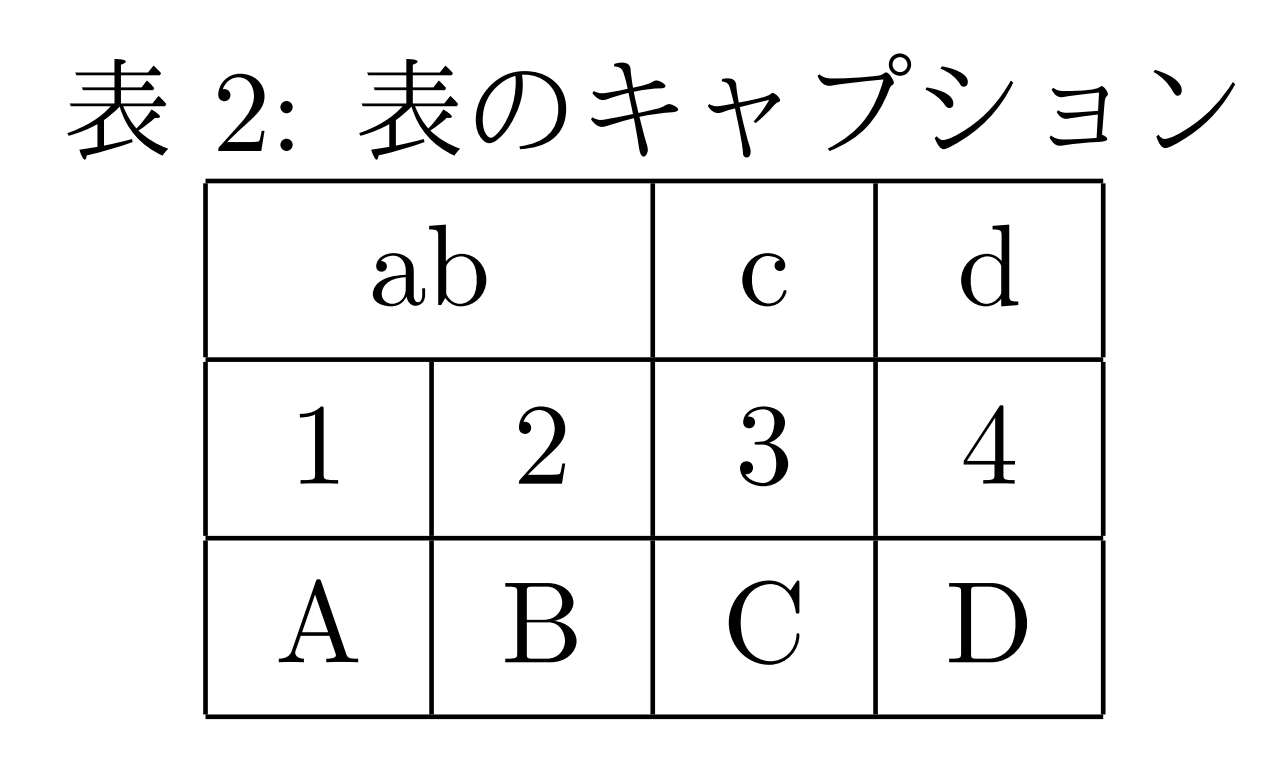
列の結合(横にまたがるセル)
\multicolumn{列数}{列の指定}{列の内容}を使います。
列の指定は中央ぞろえ(c)とか罫線(|)とか。列の内容には実際にセルに表示する文字列を入れます。
\begin{document}

\begin{table}[htbp]
 \centering
 \caption{表のキャプション}
 \begin{tabular}{|c|c|c|c|}
  \hline
  \multicolumn{2}{|c|}{ab} & c & d \\ \hline
  1 & 2 & 3 & 4 \\ \hline
  A & B & C & D \\ \hline
 \end{tabular}
\end{table}

\end{document}
Latexコマンド集 - 表組みの基礎にまとまっています。
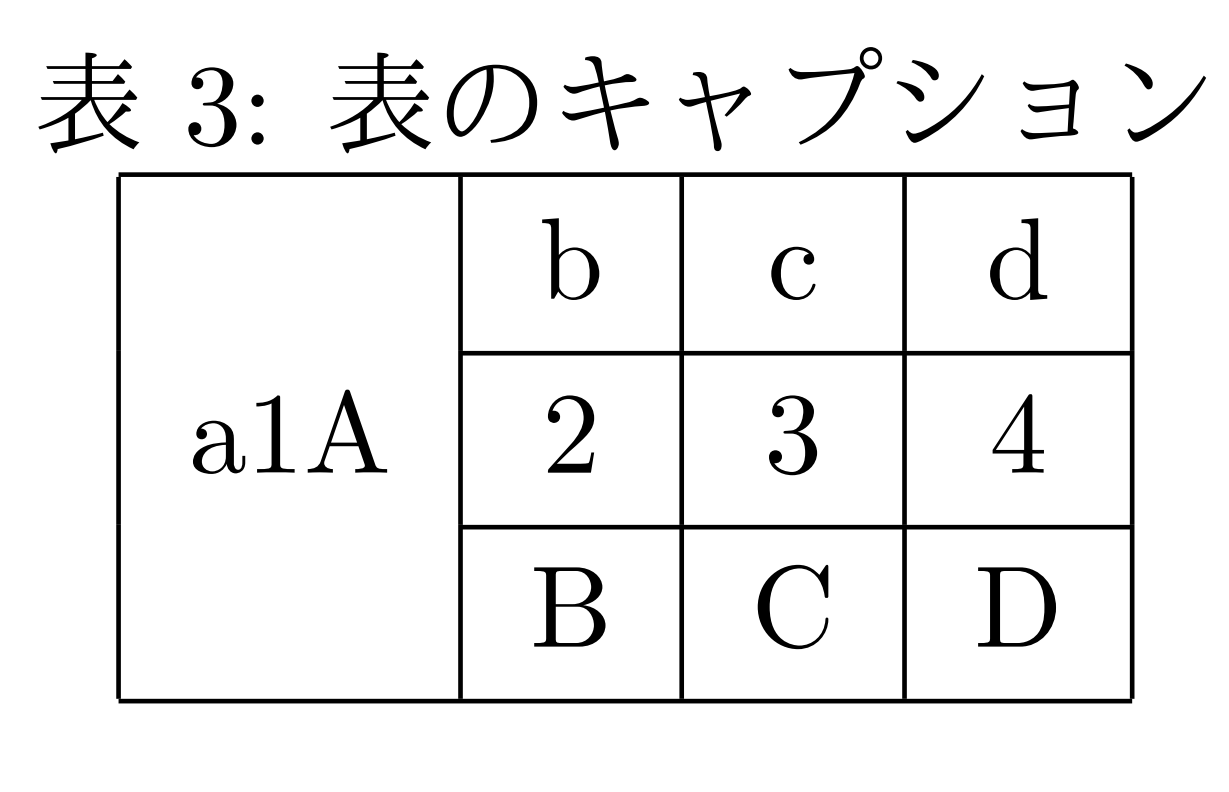
行の結合(縦にまたがるセル)
\hlineの代わりに\cline{罫線開始列番号-罫線終了列番号}を使って、「罫線を引かない」ことでセルを結合します。
\begin{document}

\begin{table}[htbp]
 \centering
 \caption{表のキャプション}
 \begin{tabular}{|c|c|c|c|}
  \hline
      & b & c & d \\ \cline{2-4}
  a1A & 2 & 3 & 4 \\ \cline{2-4}
      & B & C & D \\ \hline
 \end{tabular}
\end{table}

\end{document}
これもLatexコマンド集 - 表組みの基礎を参考に。
ただこれだと、結合する行の真ん中にセルの文字列を配置しにくい(結合する行数が偶数だと下か上に偏った配置になってしまう)。これを解消するためには、\multirow{行数}{行の指定}{セルの内容}を使うといいです。
\usepackage{multirow}

\begin{document}

\begin{table}[htbp]
 \centering
 \caption{表のキャプション}
 \begin{tabular}{|c|c|c|c|}
  \hline
   \multirow{3}{*}{a1A} & b & c & d \\ \cline{2-4}
   & 2 & 3 & 4 \\ \cline{2-4}
   & B & C & D \\ \hline
 \end{tabular}
\end{table}

\end{document}
TeXで表を結合する|たくのこWebを参考にさせていただきました。
縦書きのセル
セルの結合するときって、例えば次のように、項目の分類を表示したいとかじゃないですかね、
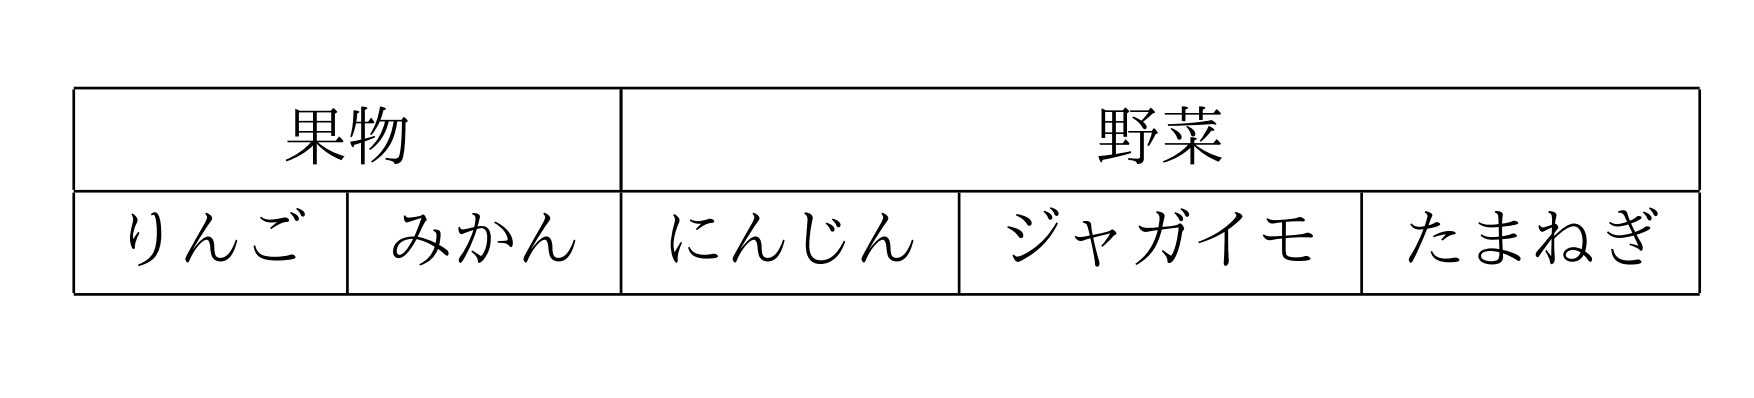
上の画像のように、結合するのが横向きとか、結合したセルの内容の文字数が少なければ問題ないです。でも、縦に結合したときに、長い文字列の内容を入れると不格好になります。そういう時に縦書きにできたらカッコよくなりそう。
下の例を見たらわかってもらえると思います。ちなみにこれは、ブラックジャックの最適戦略の表です。
\usepackage {plext}
\usepackage{multirow}

\begin{document}

\begin{table}[h]
    \centering
     \caption{プレイヤの最適方策}
     \begin{tabular}{|cc|cccccccccc|}
\hline
   && \multicolumn{10}{|c|}{ディーラの手札} \\
   && 2 & 3 & 4 & 5 & 6 & 7 & 8 & 9 & 10 & A \\ \hline
\multirow{3}{*}{\pbox<t>{\ \ \ \ \ プレイヤの手札(ハード)}} &12 & H & H & S & S & S & H & H & H & H & H \\
&13 & S & S & S & S & S & H & H & H & H & H \\
&14 & S & S & S & S & S & H & H & H & H & H \\
&15 & S & S & S & S & S & H & H & H & H & H \\
&16 & S & S & S & S & S & H & H & H & H & H \\
&17 & S & S & S & S & S & S & S & S & S & S \\
&18 & S & S & S & S & S & S & S & S & S & S \\
&19 & S & S & S & S & S & S & S & S & S & S \\
&20 & S & S & S & S & S & S & S & S & S & S \\ \hline
\multirow{3}{*}{\pbox<t>{\ \ \ \ \ プレイヤの手札(ソフト)}} &12 & H & H & H & H & H & H & H & H & H & H \\
&13 & H & H & H & H & H & H & H & H & H & H \\
&14 & H & H & H & H & H & H & H & H & H & H \\
&15 & H & H & H & H & H & H & H & H & H & H \\
&16 & H & H & H & H & H & H & H & H & H & H \\
&17 & H & H & H & H & H & H & H & H & H & H \\
&18 & S & S & S & S & S & S & S & H & H & H \\
&19 & S & S & S & S & S & S & S & S & S & S \\
&20 & S & S & S & S & S & S & S & S & S & S \\ \hline
\end{tabular}
\end{table}

\end{document}
出力は次のようになります。
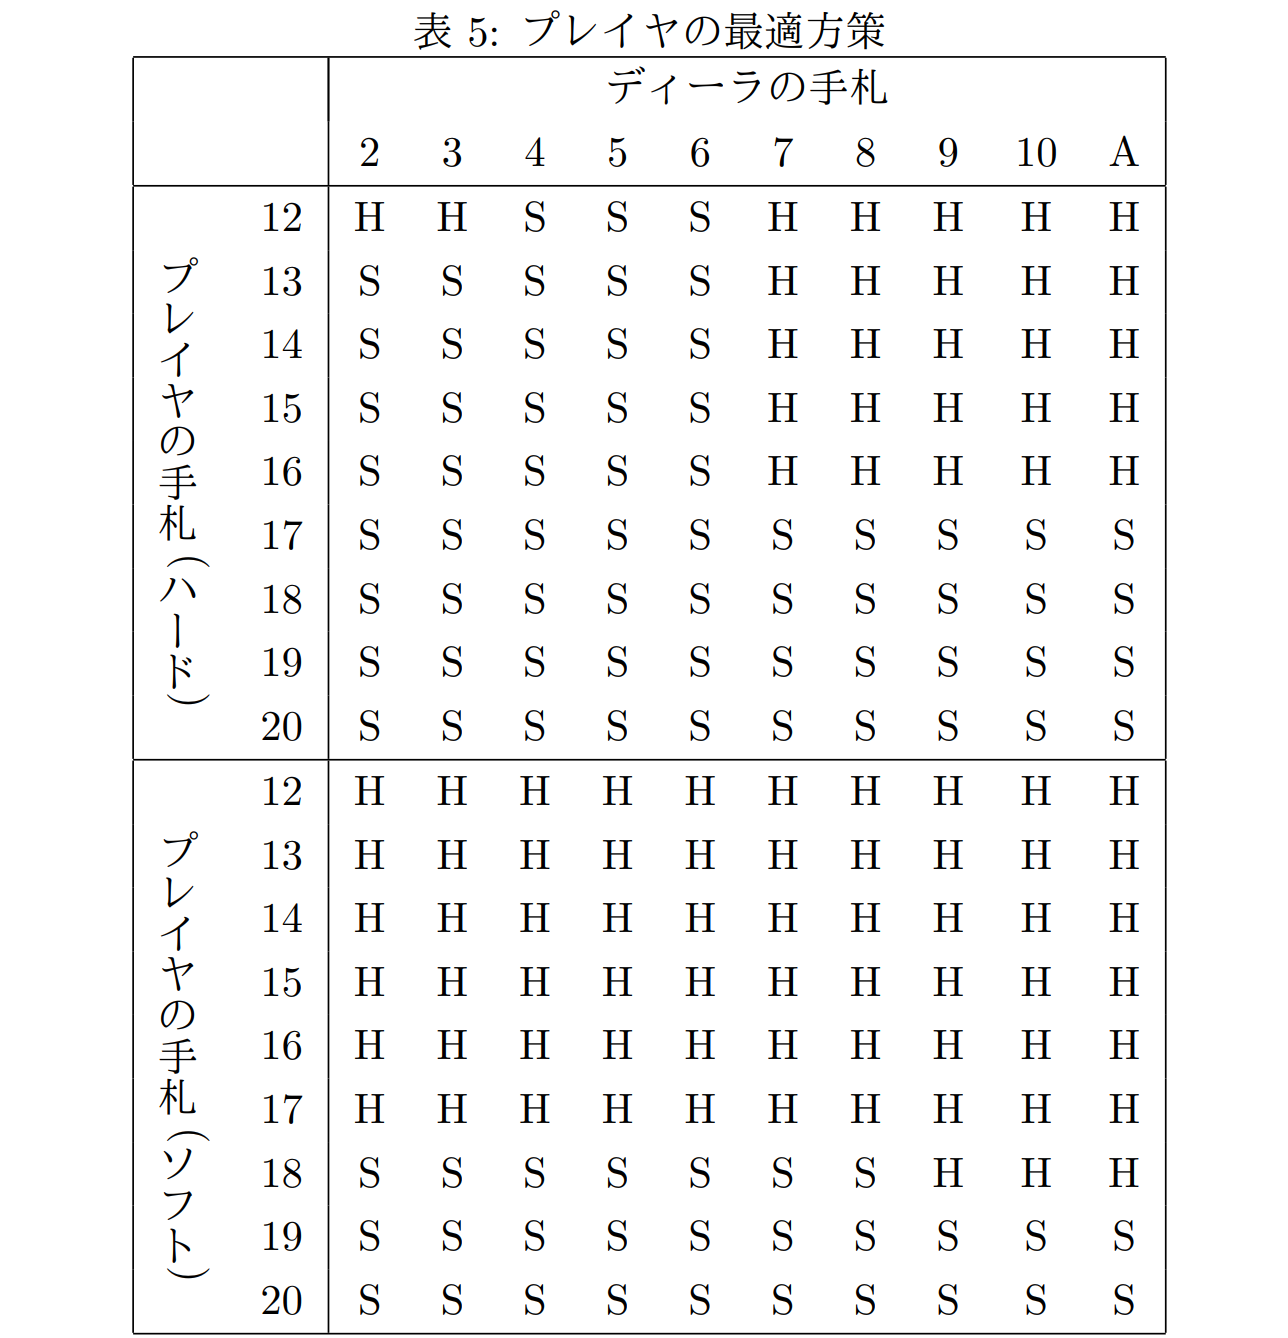
\usepackage{plext}をプリアンブルに記述して、\pbox<t>{内容}とすれば「内容」が縦書きになります。
上のコードで「内容」の部分に\がいっぱい書いてあるのは位置を微調節しただけなので気にしないでください。
これはLaTeXで「部分的な縦書き」 - Qiitaを参考にさせていただきました。
ソースコード
ソースコードを載せる時のテンプレート。
\usepackage{listings,jlisting}
\lstset{
basicstyle={\ttfamily},
identifierstyle={\small},
commentstyle={\smallitshape},
keywordstyle={\small\bfseries},
ndkeywordstyle={\small},
stringstyle={\small\ttfamily},
frame={tb},
breaklines=true,
columns=[l]{fullflexible},
numbers=left,
xrightmargin=0zw,
xleftmargin=3zw,
numberstyle={\scriptsize},
stepnumber=1,
numbersep=1zw,
lineskip=-0.5ex
}
\begin{document}
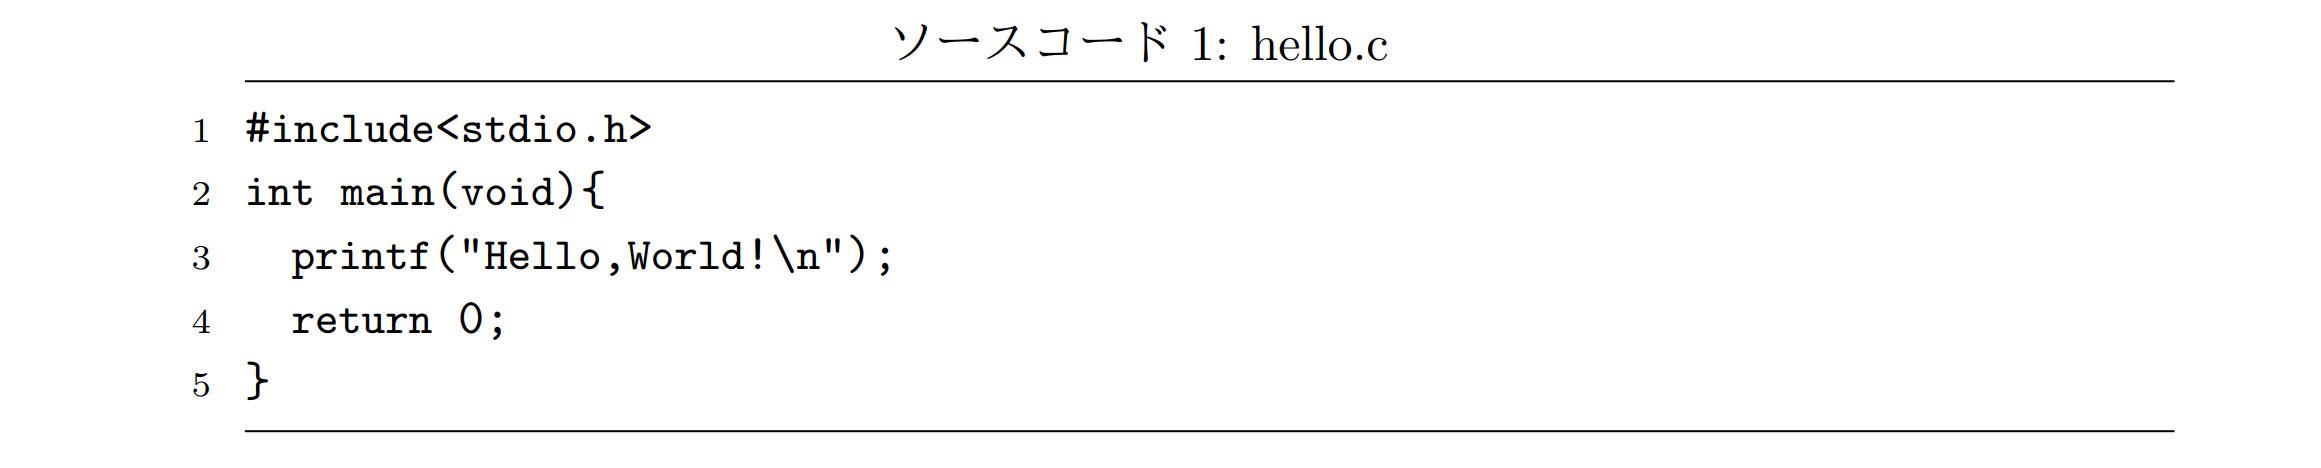
\begin{lstlisting}[caption=hello.c]
# include<stdio.h>
int main(void){
printf("Hello,World!\n");
return 0;
}
\end{lstlisting}
\end{document}
出力は下のようになります。
lstlistingでググるとたくさんサンプルが出てきます。好きなサンプルを選ぶのがいいと思います。