はじめに
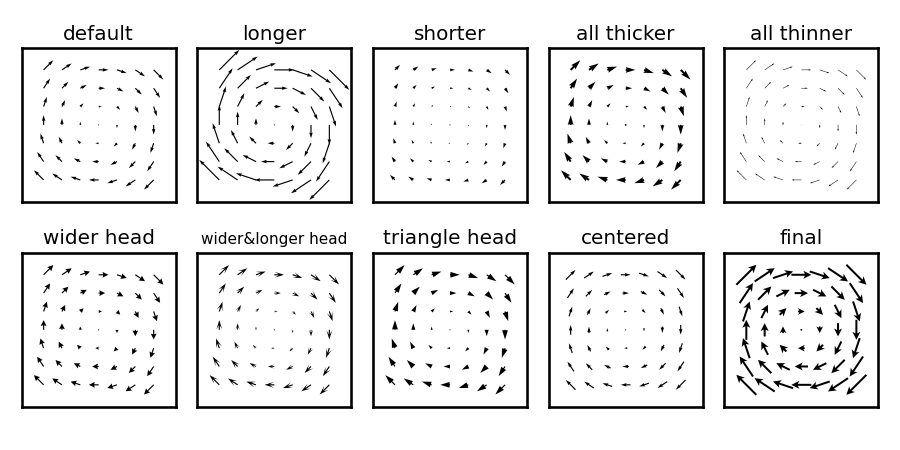
Pythonのmatplotlibにベクトル場を描画するquiver (クイバー) という関数があります。既定値のまま使う分には問題ありませんが、細かいパラメータ調節をしようとすると非常にやりづらいです。ヘルプを読めばちゃんと書いてありますが、理解するまでに時間がかかります。以下にコツを紹介します。
どうして難しいのか?
- 各用語が何を指すかが分からない
-
scaleが小さいほど矢印が長く、大きいほど短くなる -
widthの既定の単位がピクセルでない (適当に1とかに設定すると大惨事になる) -
widthを変えると、矢印の線の太さだけでなく矢印の先端部分も連動して変化する -
headwidth,headlength,headaxislengthはwidthに対する倍率で指定する -
headaxislengthがheadlengthと連動していない
解決法
- 各用語の意味は以下の図を参考にする

-
sclaleは、最大長の逆数の1.5倍で指定する (例、最大20ピクセルならunits='dots', scale=1.5/20) -
widthの単位はピクセルに変える (units='dots') - 先に
widthを決めた後でheadwidth,headlength,headaxislengthを調節する -
headwidth,headlength,headaxislengthの調節では、もし倍率指定が分かりにくければ、別変数を用意してピクセルで指定し、それらをwidthで割ってquiver関数に渡す -
headaxislengthはheadlengthと同じ値にするか (凹みなし)、0.9倍から0.8倍程度にする (凹みあり)
確認用コード
# 関連パッケージの読み込み
import numpy as np
import matplotlib.pyplot as plt
import seaborn as sns
sns.set_context('talk', font_scale=0.8)


# メイン関数
def test_quiver():


  ### 適当なベクトル場を作成 ###

  # x軸とy軸
  x_arr = np.linspace(-1, 1, 7)  # -1から1まで等間隔に7点
  y_arr = np.linspace(-1, 1, 7)  # 同上

  # 2次元の格子に変換
  X ,Y = np.meshgrid(x_arr, y_arr)

  # 極座標系に変換
  R = (X**2 + Y**2)**0.5    # 原点からの距離
  Q = np.angle(X + 1j * Y)  # 角度 (複素数に変換して計算)

  # 時計回りのベクトル場
  U =  R * np.sin(Q)  # x成分
  V = -R * np.cos(Q)  # y成分


  ### 描画 ###

  # fig, axの用意
  fig, axes = plt.subplots(figsize=(9, 4.5), ncols=5, nrows=2)
  axes = axes.flatten()

  # 既定
  ax = axes[0]
  ax.quiver(X, Y, U, V)
  ax.set_title('default')

  # 長くする
  ax = axes[1]
  ax.quiver(X, Y, U, V, units='dots', scale=1.5/30)
  ax.set_title('longer')

  # 短くする
  ax = axes[2]
  ax.quiver(X, Y, U, V, units='dots', scale=1.5/7.5)
  ax.set_title('shorter')

  # 全体的に太くする
  ax = axes[3]
  ax.quiver(X, Y, U, V, units='dots', width=2)
  ax.set_title('all thicker')

  # 全体的に細くする
  ax = axes[4]
  ax.quiver(X, Y, U, V, units='dots', width=0.5)
  ax.set_title('all thinner')

  # 矢印の先端を太くする
  ax = axes[5]
  ax.quiver(X, Y, U, V, units='dots', headwidth=5)
  ax.set_title('wider head')

  # 矢印の先端を太く、長くする
  ax = axes[6]
  ax.quiver(X, Y, U, V, units='dots', headwidth=5, headlength=8)
  ax.set_title('wider&longer head', fontsize=11)

  # 矢印の先端を三角形にする
  ax = axes[7]
  ax.quiver(X, Y, U, V, units='dots', headwidth=5, headlength=8,
            headaxislength=8)
  ax.set_title('triangle head')

  # 各矢印の中心 (長さ半分の位置) を座標点に合わせる
  ax = axes[8]
  ax.quiver(X, Y, U, V, pivot='mid')
  ax.set_title('centered')

  # 色々調節した完成形
  ax = axes[9]
  units = 'dots'     # 単位をピクセルにする
  arrow_length = 30  # 矢印の最大長
  arrow_width  = 2   # 矢印の太さ
  head_length  = 8   # 矢印の先端の長さ (固定長)
  head_width   = 8   # 矢印の先端の幅 (固定長)
  head_dip = 0.2     # 矢印の先端の裏側の凹み具合 (0から0.2程度までを推奨)
  kws = dict(units = units,
             scale = 1.5 / arrow_length,
             width = arrow_width,
             headwidth      = head_width  / arrow_width,
             headlength     = head_length / arrow_width,
             headaxislength = (1 - head_dip) * head_length / arrow_width)
  ax.quiver(X, Y, U, V, pivot='mid', **kws)
  ax.set_title('final')

  # 共通設定
  for ax in axes:
    ax.set_xticks([])       # x軸の目盛りを消す
    ax.set_yticks([])       # y軸の目盛りを消す
    ax.set_aspect('equal')  # 縦横比を1:1にする
    ax.margins(0.2)         # 描画範囲を少し拡大

  # 余白を減らす
  fig.tight_layout()

  # 完成した図を表示
  fig.show()

  # ファイルに保存
  fig.savefig('tmp.png')
