はじめに
音声の波形を表示するコードを書いた時のメモ。
librosaというライブラリのlibrosa.display.waveplotを使用するのが簡単だが,音声ファイルのデータ数が多い場合エラーが生じるため,素直にmatplotlib.pyplotを使用して表示する方法も記す。
librosa.display.waveplotを使用する方法
最も簡単な方法。
コード
import librosa

def make_waveform_librosa(filename):
    y, sr = librosa.load(filename)
    librosa.display.waveplot(y, sr=sr)

make_waveform_librosa("test.mp3")
結果

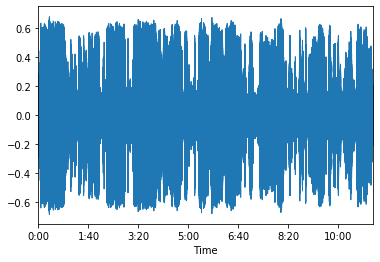
しかし,読み込む音声ファイルのデータ数が大きい場合,OverflowError: Exceeded cell block limitとなり,上手く波形が表示できないことがある。
matplotlib.pyplotを使用する方法
matplotlibのバックエンドで動いているaggのchunksizeを変更することができるため,音声ファイルのデータ数が大きい場合にも対応することができる。
コード
import matplotlib.pyplot as plt
import matplotlib
import librosa

def make_waveform_pyplot(filename):
    y, sr = librosa.load(filename)
    totaltime = len(y)/sr
    time_array = np.arange(0, totaltime, 1/sr)
    mpl.rcParams['agg.path.chunksize'] = 100000
    fig, ax = plt.subplots()
    formatter = mpl.ticker.FuncFormatter(lambda s, x: time.strftime('%M:%S', time.gmtime(s)))
    ax.xaxis.set_major_formatter(formatter)
    ax.set_xlim(0, totaltime)
    ax.set_xlabel("Time")
    ax.plot(time_array, y)
    plt.show()

make_waveform_pyplot("test.mp3")
chunksizeはここを参照すると以下のように書いてあったので,適当に100000としておきました。
### Agg rendering
### Warning: experimental, 2008/10/10
# agg.path.chunksize : 0           # 0 to disable; values in the range
                                  # 10000 to 100000 can improve speed slightly
                                  # and prevent an Agg rendering failure
                                  # when plotting very large data sets,
                                  # especially if they are very gappy.
                                  # It may cause minor artifacts, though.
                                  # A value of 20000 is probably a good
                                  # starting point.
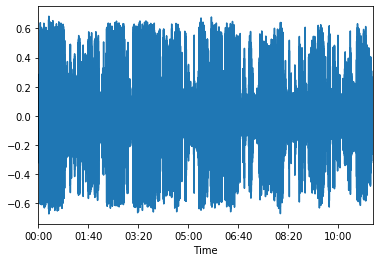
結果

librosa.display.waveplotと同じものを出力することができた。
おわりに
librosa.display.waveplotも内部でmatplotlibを使用しているので,同じようにchunksizeを弄れば表示できるようになるとは思いますが,直接ライブラリのコードを弄る必要があると思われます。