billboarderとは?
Rでインタラクティブなプロットを書きたいときに、最近自分はbillboarderを好んで使用しています。おそらく日本でこれを使っている人をあまり見たことがないので、いくつかサンプルコードを紹介します
billboarderのbillboard.jsのRラッパー。billboard.jsはNAVERが開発しているようで、安心のMITライセンスです

billboarderはShiny系のRパッケージの開発で有名なdreamRsの開発している。彼らが紹介しているShinyAppでもbillboarderがよく使用されています
参考
使い方
以下のサイトを見てくれればどんなプロットができるかがわかると思います
Create Interactive Chart with the JavaScript Billboard Library • billboarder
ひとまずライブラリをロード
> library(billboarder)
> print(packageVersion("billboarder"))
[1] ‘0.2.7’
ここでは、自分が最近よく使ってる線プロットと棒グラフとShinyの例の3つの事例を紹介します
サンプルデータ1
適当なSubjectごとの時系列データとしてIndomethを利用します
> data(Indometh)
> head(Indometh, 10)
   Subject time conc
1        1 0.25 1.50
2        1 0.50 0.94
3        1 0.75 0.78
4        1 1.00 0.48
5        1 1.25 0.37
6        1 2.00 0.19
7        1 3.00 0.12
8        1 4.00 0.11
9        1 5.00 0.08
10       1 6.00 0.07
Subjectをわかりやすくするため加工します
Indometh$Subject <- paste0("s",as.character(Indometh$Subject))
事例1: 線プロット
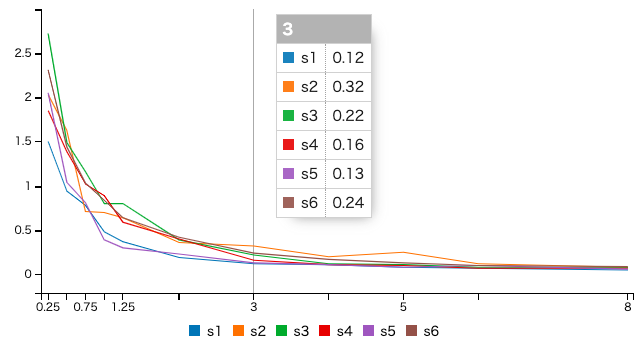
最小実行コードとして以下でOK。縦持ちデータをそのまま扱えるので、ggplotに慣れた我々にとっては馴染みのある感じで入力できます。非常にシンプルなコードでインタラクティブな線プロットができます
billboarder(data = Indometh) %>%
  bb_linechart(
    mapping = bbaes(x = time, y = conc, group = Subject)
  )
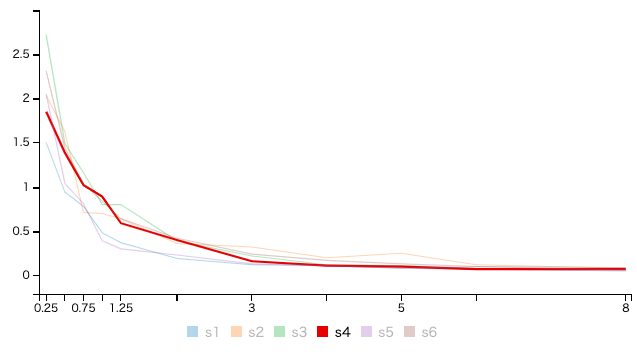
凡例の上にカーソルを持っていけばそれだけがハイライトされます(下の図はs4の上にマウスカーソルがある)
さらに、billboarder横持ちデータを入力として使えます。コードはよりシンプルに。一旦横持ちデータを準備します
> Indometh_wide <- Indometh %>% tidyr::spread(Subject, conc)
> head(Indometh_wide, 10)
   time   s1   s2   s3   s4   s5   s6
1  0.25 1.50 2.03 2.72 1.85 2.05 2.31
2  0.50 0.94 1.63 1.49 1.39 1.04 1.44
3  0.75 0.78 0.71 1.16 1.02 0.81 1.03
4  1.00 0.48 0.70 0.80 0.89 0.39 0.84
5  1.25 0.37 0.64 0.80 0.59 0.30 0.64
6  2.00 0.19 0.36 0.39 0.40 0.23 0.42
7  3.00 0.12 0.32 0.22 0.16 0.13 0.24
8  4.00 0.11 0.20 0.12 0.11 0.11 0.17
9  5.00 0.08 0.25 0.11 0.10 0.08 0.13
10 6.00 0.07 0.12 0.08 0.07 0.10 0.10
横持ちならデータを入力するだけ。簡単!
billboarder(data = Indometh_wide) %>%
  bb_linechart()
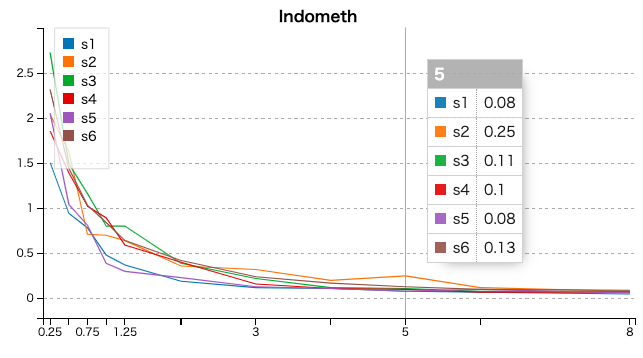
いろいろとメイクアップしてみます。だいたいこれできれいな感じになります(適当)
billboarder(data = Indometh_wide) %>%
  bb_linechart() %>%
  bb_y_grid(show = T) %>%
  bb_legend(position = "inset") %>%
  bb_zoom(
    enabled = list(type = "drag"),
    resetButton = list(text = "Unzoom")
  ) %>%
  bb_title(text = "Indometh", position = "center") %>%
  bb_y_axis(
    tick = list(format = htmlwidgets::JS("d3.format(',')"))
  )
サンプルデータ2
棒グラフを描く前に別のサンプルデータを用意します。ここではCO2データを準備
> data(CO2)
>
> CO2_mean <- CO2 %>%
  group_by(Type, Treatment) %>%
  dplyr::summarise(mean_conc = mean(conc)) %>%
  tidyr::spread(Treatment, mean_conc)
> CO2_mean
# A tibble: 2 x 3
# Groups:   Type [2]
  Type        nonchilled chilled
  <fct>            <dbl>   <dbl>
1 Quebec             435     435
2 Mississippi        435     435
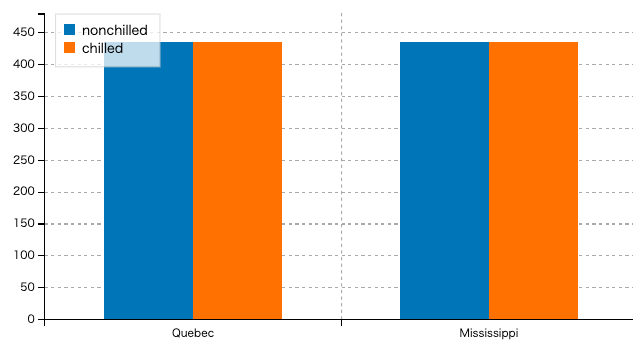
事例2: 棒グラフ
最小実行コードは以下のような感じ
billboarder(data = CO2_mean) %>%
  bb_barchart(stacked = F)
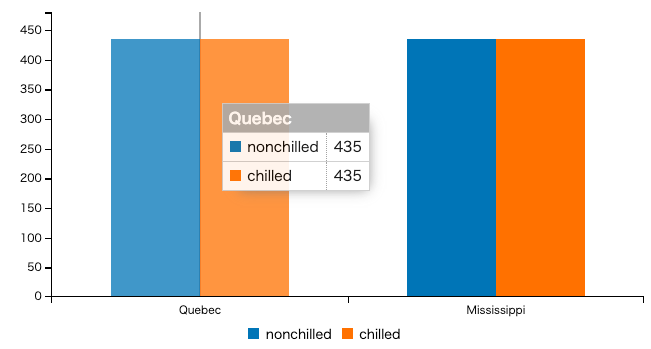
いろいろとメイクアップしてみます。だいたいこれできれいな感じになります(適当)
billboarder(data = CO2_mean) %>%
  bb_barchart(stacked = F) %>%
  bb_x_grid(show = T) %>%
  bb_y_grid(show = T) %>%
  bb_legend(position = "inset") %>%
  bb_zoom(
    enabled = list(type = "drag"),
    resetButton = list(text = "Unzoom")
  ) %>%
  bb_title(text = title, position = "center") %>%
  bb_y_axis(
    tick = list(format = htmlwidgets::JS("d3.format(',')"))
  )
事例3: Shiny
billboarderのtooltipを使えば、便利なインタラクティブ機能が簡単に作れるみたいです
ここでは、マウスカーソルのx軸の値に該当する箇所に複数のグラフを跨いで縦線を描いてくれる機能を紹介します
複数の時系列グラフを同時に確認するケースでとても有効ですね
デモ : https://okiyuki.shinyapps.io/ex_billboarder/
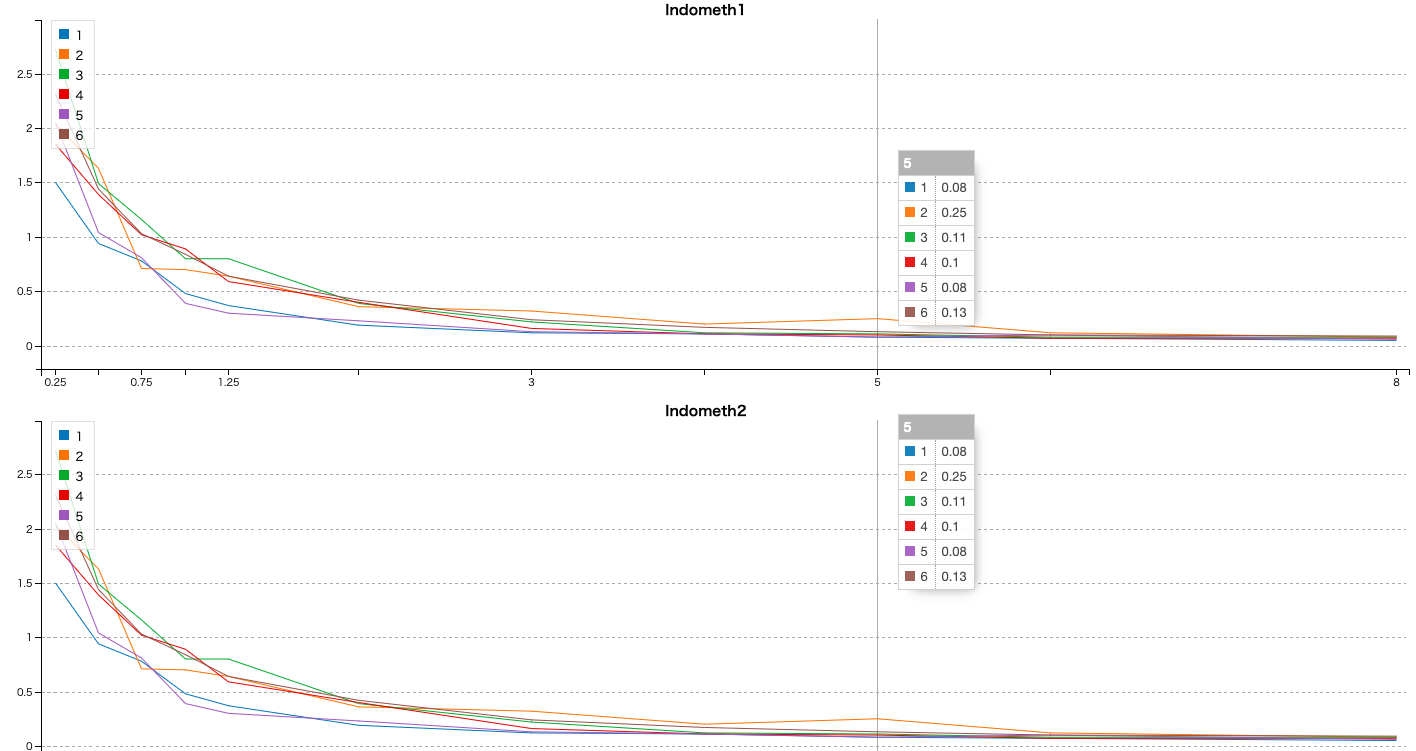
コードはこんな感じ。bb_tooltip(linked = list(name = "tooltip-test")) だけでOK
library(shiny)
library(billboarder)

ui <- fluidPage(
  billboarderOutput(outputId = "Indo1"),
  billboarderOutput(outputId = "Indo2")
)

server <- function(input, output, session) {

  data(Indometh)
  Indometh_wide <- Indometh %>% tidyr::spread(Subject, conc)

  output$Indo1 <- renderBillboarder({
    billboarder(data = Indometh_wide) %>%
      bb_linechart() %>%
      bb_y_grid(show = T) %>%
      bb_legend(position = "inset") %>%
      bb_zoom(
        enabled = list(type = "drag"),
        resetButton = list(text = "Unzoom")
      ) %>%
      bb_title(text = "Indometh1", position = "center") %>%
      bb_y_axis(
        tick = list(format = htmlwidgets::JS("d3.format(',')"))
      ) %>%
      bb_tooltip(
        linked = list(name = "tooltip-test"),
        format = list(value = htmlwidgets::JS("d3.format(',')"))
      )
  })

  output$Indo2 <- renderBillboarder({
    billboarder(data = Indometh_wide) %>%
      bb_linechart() %>%
      bb_y_grid(show = T) %>%
      bb_legend(position = "inset") %>%
      bb_zoom(
        enabled = list(type = "drag"),
        resetButton = list(text = "Unzoom")
      ) %>%
      bb_title(text = "Indometh2", position = "center") %>%
      bb_y_axis(
        tick = list(format = htmlwidgets::JS("d3.format(',')"))
      ) %>%
      bb_tooltip(
        linked = list(name = "tooltip-test"),
        format = list(value = htmlwidgets::JS("d3.format(',')"))
      )
  })
}

shinyApp(ui = ui, server = server)
まとめ
- インタラクティブな可視化にbillboarderというのがあるというご紹介
- お手軽に使えるのでおすすめ