データ視覚化のデザインって?
UXやUIを突き詰めたサービスで有名なTHE GUILDのGo Andoさんがnoteで公開した、データの視覚化のポイントをまとめたもの。
#1, #2 は?
-
#1は以下を参照
-
#2は以下を参照
注意事項
- フォントについて、macでは動きますが他OSだと多分動かないので別のフォントを指定してください。
plt.rcParams['font.family'] = 'Hiragino Sans'
の部分です。
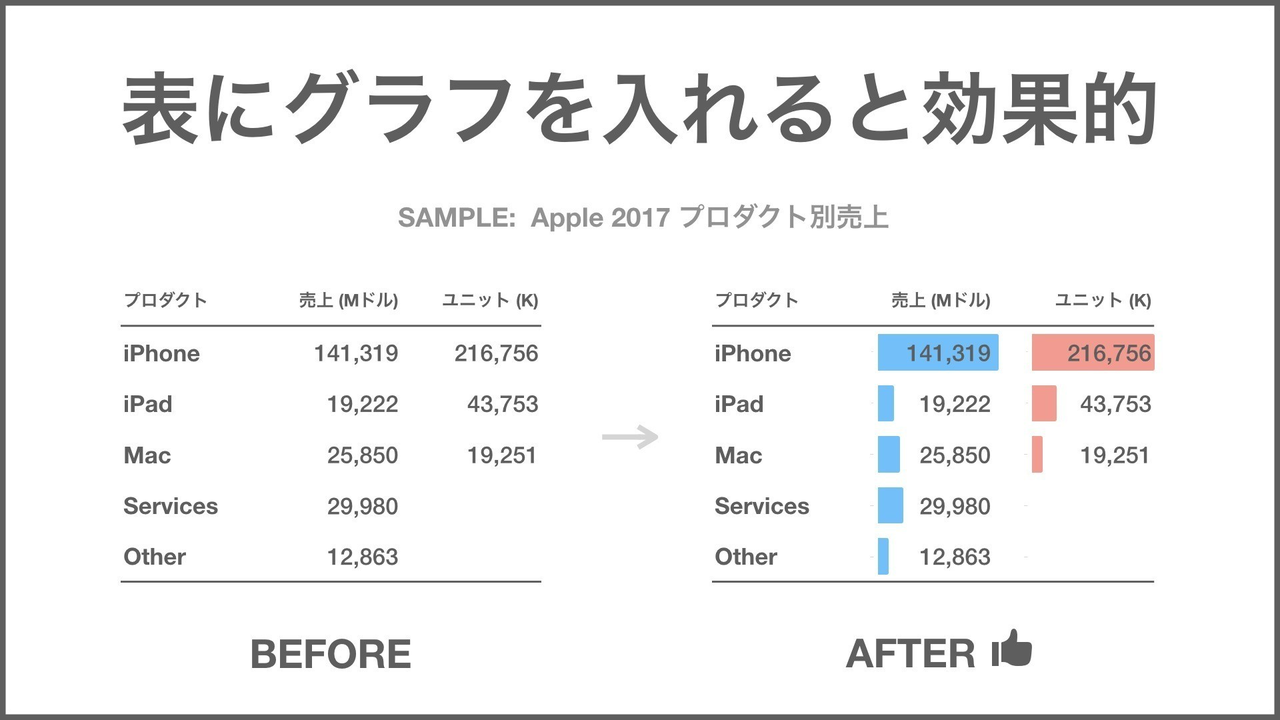
13. 表にグラフを入れると効果的
pandasを利用。
import pandas as pd
import numpy as np

%matplotlib inline
# data
apple_products = pd.DataFrame({"プロダクト":["iPhone","iPad","Mac","Services","Other"],
                              "売上(Mドル)":[141319,19222,25859,29980,12863],
                             "ユニット":[216756,43753,19251,np.nan,np.nan]})

# 値のフォーマット
format_dict = {'売上(Mドル)':'{0:,.0f}', 'ユニット':'{0:,.0f}'}

# グラフの設定をしながら表示
(apple_products
 .style
 .format(format_dict)
 .hide_index()
 .bar(color="#99ceff", vmin=0, subset=['売上(Mドル)'], align='zero')
 .bar(color="#ff999b", vmin=0, subset=['ユニット'], align='zero'))

- 値のフォーマットの部分では3桁ごとにカンマ区切りに1
- 表についてはpandasのstyling機能を使用2
- nanについて、0で埋めても良かったがユニットにservicesとotherは該当しないだろうという理由からnanのままにした
- .bar()の部分について、align='zero'と指定することで、グラフが適度な大きさになる
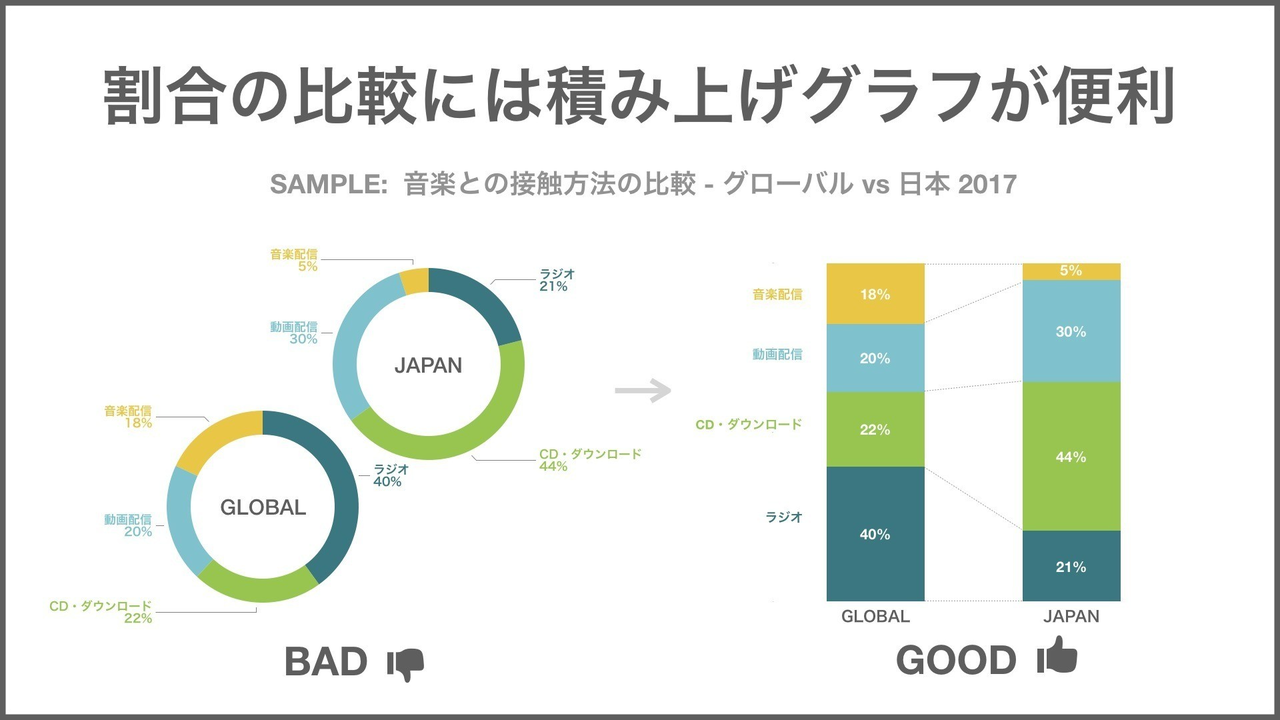
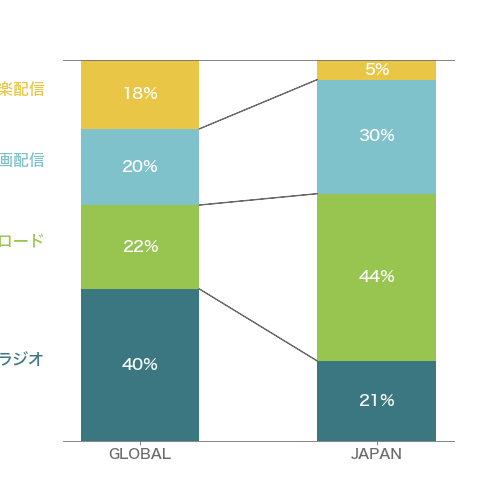
15. 割合の比較には積み上げグラフが便利
import pandas as pd
import numpy as np
import matplotlib.pyplot as plt
import matplotlib.dates as mdates


# pandasでのエラー回避用
from pandas.plotting import register_matplotlib_converters
register_matplotlib_converters()

# フォント設定
plt.rcParams['font.family'] = 'Hiragino Sans'
plt.rcParams['font.weight'] = 'heavy'

# データ
music_env_df = pd.DataFrame({"ラジオ":[0.4,0.21],"CD・ダウンロード":[0.22,0.44],"動画配信":[0.2,0.3],"音楽配信":[0.18,0.05]},
            index=["GLOBAL","JAPAN"])
# 積み上げグラフ用
music_env_df.T.cumsum()
# グラフの色
bar_colors = ["#3B7780","#98C550","#7FC2CB","#E9C645"]

# x ticklabel を取得
x = music_env_df.index
# グラフの各項目名
keys = music_env_df.keys()

fig,ax = plt.subplots(figsize=(7,7))

# 1. 左右の枠を消去
sides = ['left','right']
[ax.spines[side].set_visible(False) for side in sides]

# 2. 左軸メモリ、メモリラベル削除
ax.tick_params(left=False, labelleft=False)

# 3. 上下枠線の色変更
ax.spines['bottom'].set_color("dimgray")
ax.spines['top'].set_color("dimgray")

# 4. x軸メモリ設定
ax.tick_params(axis='x', labelsize='x-large',color="dimgray",labelcolor="dimgray")

# 5. 積み上げグラフをプロットおよびプロットの情報を格納
bar_info = []
for i in range(len(keys)):
    if i == 0:
        bar_info.append(ax.bar(x, music_env_df.T.iloc[i],width=0.5,color=bar_colors[i]))
    else:
        bar_info.append(ax.bar(x, music_env_df.T.iloc[i], bottom=music_env_df.T.cumsum().iloc[i-1],width=0.5,color=bar_colors[i]))

# 6. 各グラフの項目
for i,one in enumerate(bar_info):
    # %の数値を格納
    bar_center = [[0,0],[0,0]]
    #  棒グラフ同士の差を強調する線の座標を格納
    bar_line = [[0,0],[0,0]]
    for j,one_bar in enumerate(one):
        bar_center[j][0] =  one_bar.xy[0]+one_bar.get_width()/2
        bar_center[j][1] =  one_bar.xy[1]+one_bar.get_height()/2
        # 項目名を表示
        if j == 0:
            ax.annotate(keys[i],xy=(0,0),xycoords="data",
                       xytext=(-0.4,bar_center[j][1]),
                       ha='right',color=bar_colors[i],fontsize=16)
            bar_line[j][0] = one_bar.xy[0]+one_bar.get_width()
            bar_line[j][1] = one_bar.xy[1]
        else:
            bar_line[j][0] = one_bar.xy[0] - bar_line[0][0]
            bar_line[j][1] = one_bar.xy[1] - bar_line[0][1]
        # 割合の数値(%)を表示
        ax.annotate(f'{one_bar.get_height():.0%}',xy=(0,0),xycoords="data",
                   xytext=(bar_center[j][0],bar_center[j][1]),
                   ha="center",va="center",color="white",fontsize=16)
        # 強調の線を表示
        ax.arrow(bar_line[0][0],bar_line[0][1], bar_line[1][0], bar_line[1][1], head_width=0, head_length=0, ec='dimgray')

# 7. 縦軸の領域を設定
ax.set_ylim(0,1)
- 積み上げ用に累和データを作成(
music_env_df.T.cumsum()) - #6の強調の線については、GLOBAL棒グラフの右上からJAPAN棒グラフの左上を結ぶようにしている
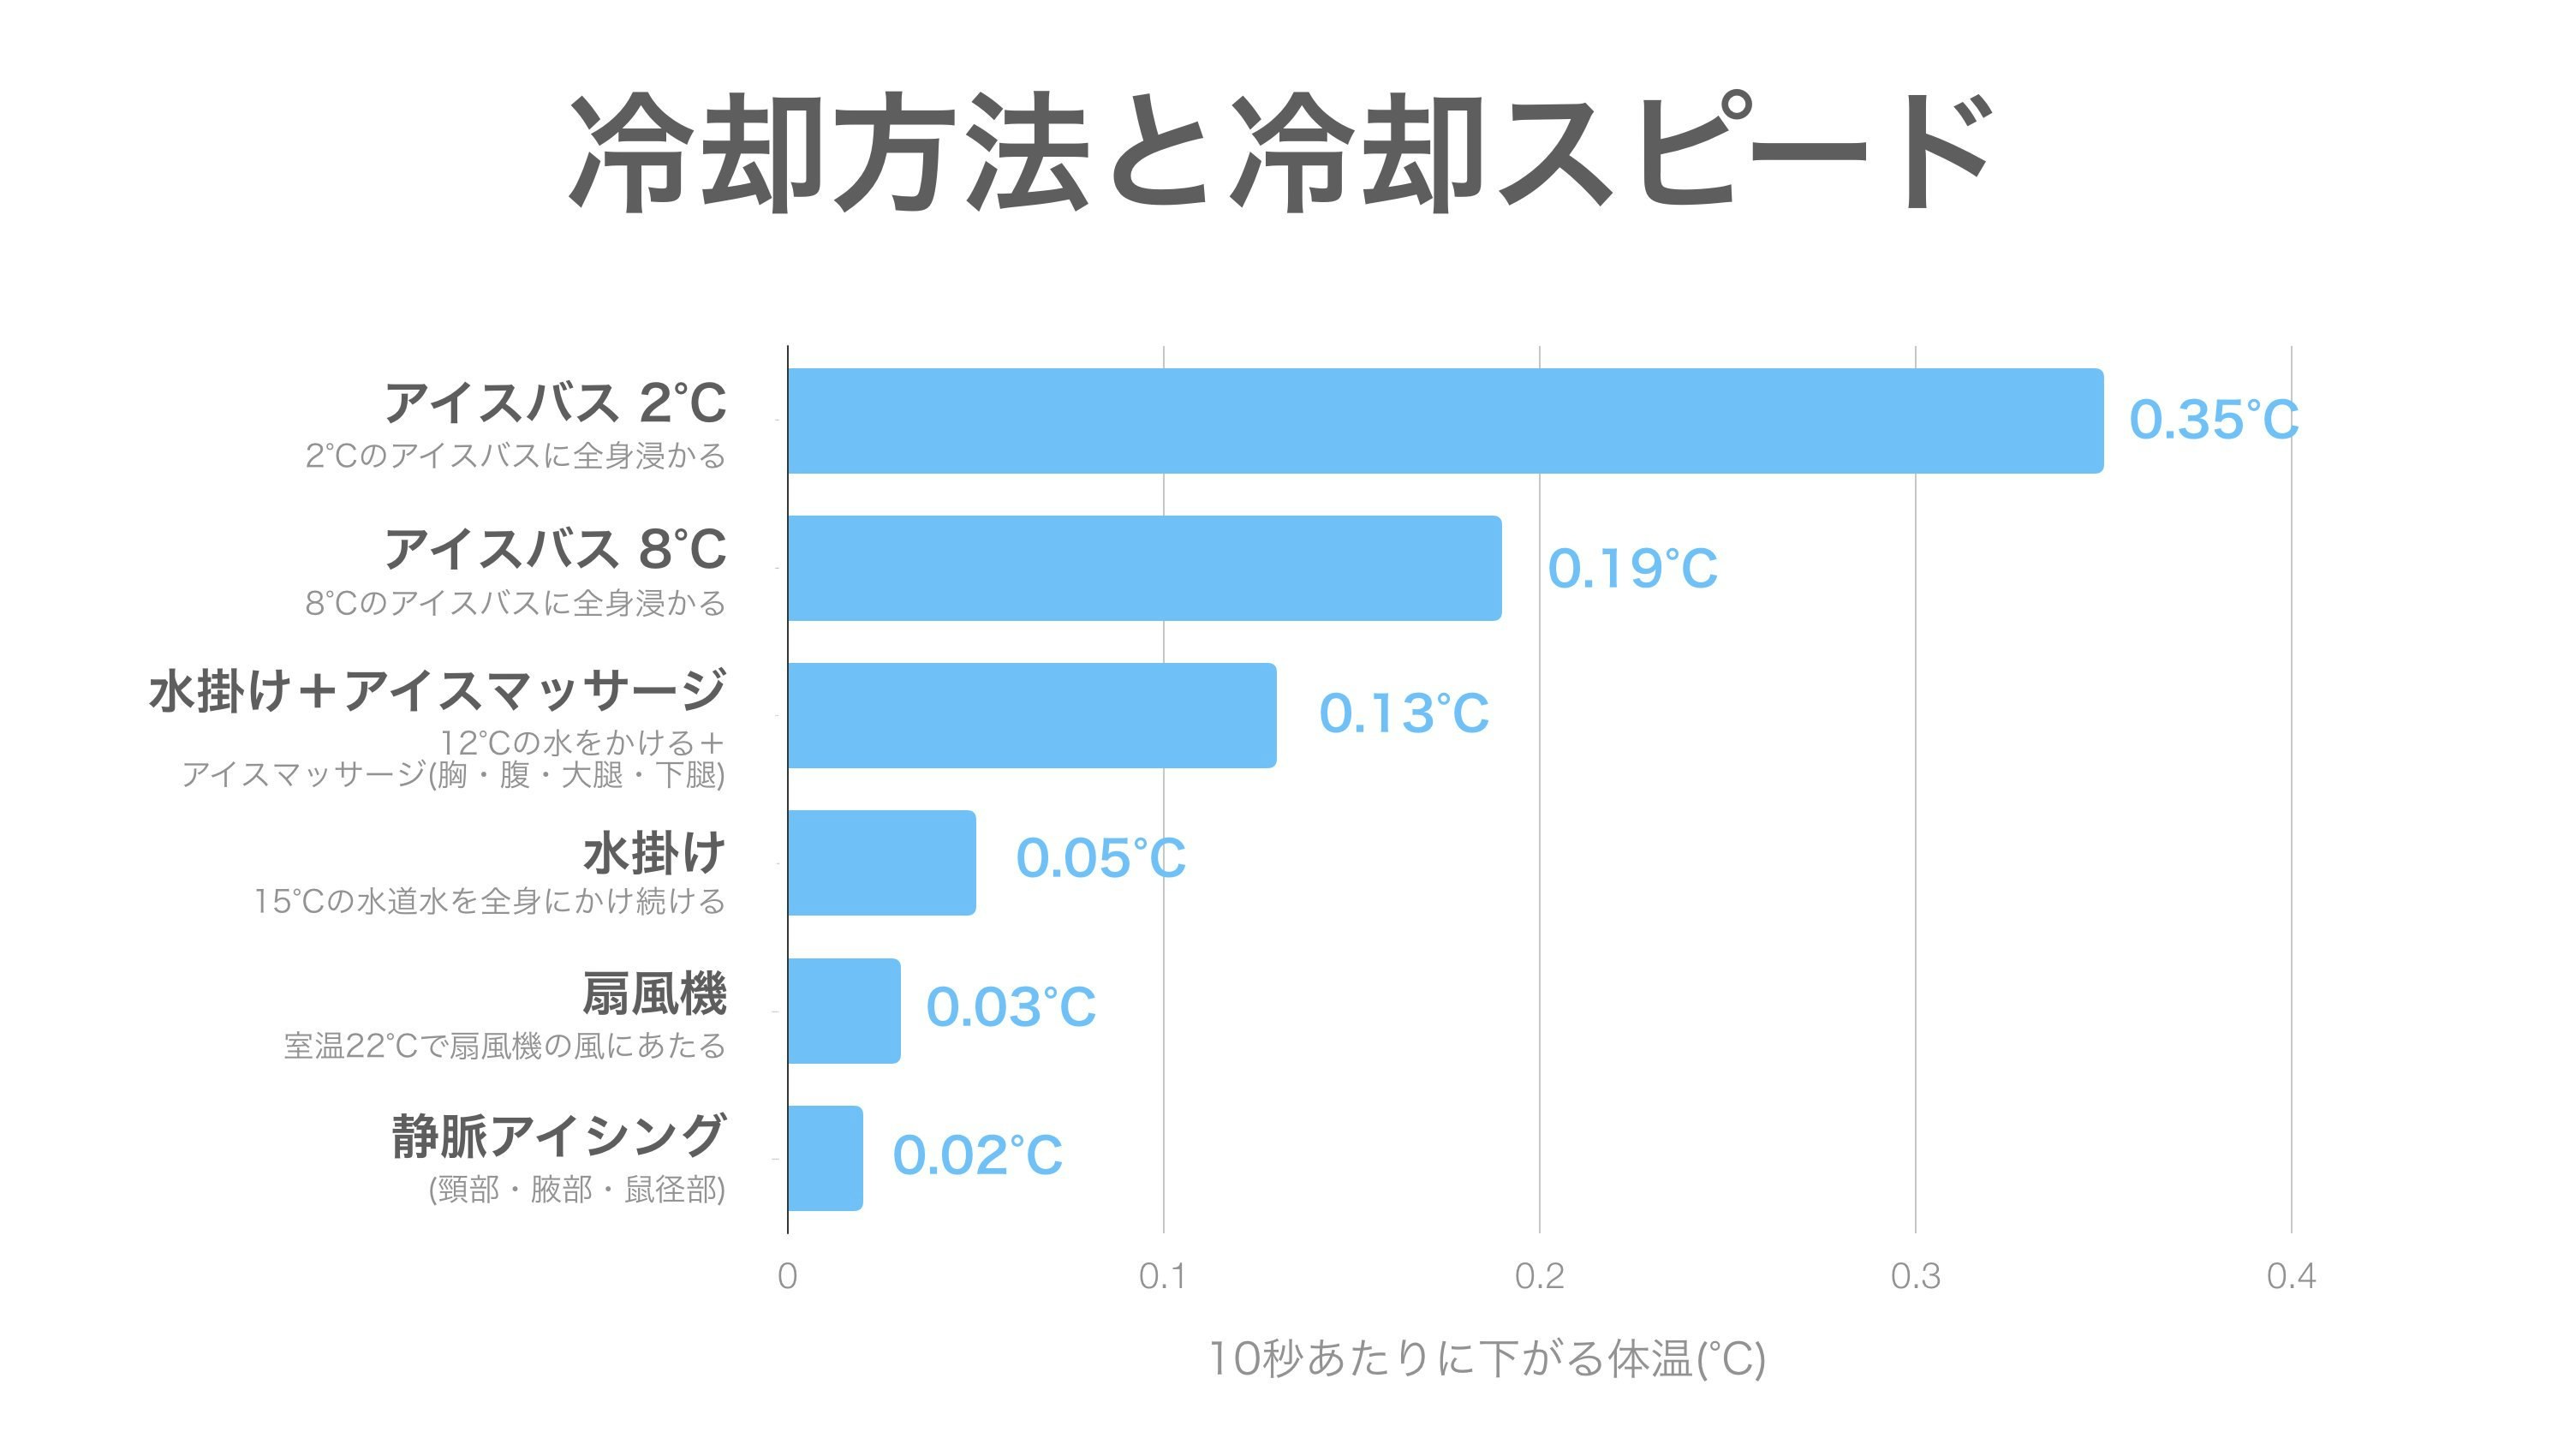
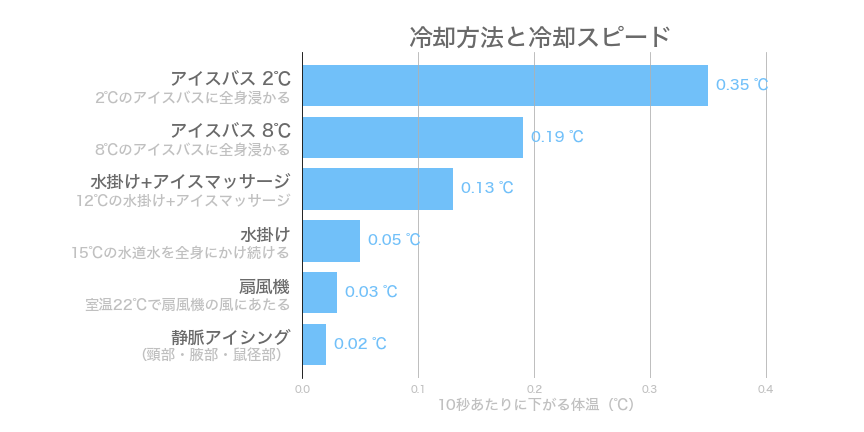
番外編 #1
import pandas as pd
import numpy as np
import matplotlib.pyplot as plt
import matplotlib.dates as mdates


# pandasでのエラー回避用
from pandas.plotting import register_matplotlib_converters
register_matplotlib_converters()

# フォント設定
plt.rcParams['font.family'] = 'Hiragino Sans'
plt.rcParams['font.weight'] = 'heavy'

# データ
icing_method = pd.DataFrame([0.35, 0.19, 0.13,0.05,0.03,0.02],
                           index=['アイスバス 2℃', 'アイスバス 8℃', '水掛け+アイスマッサージ','水掛け','扇風機','静脈アイシング'],
                           columns=['冷却スピード'])

icing_detail = ["2℃のアイスバスに全身浸かる","8℃のアイスバスに全身浸かる","12℃の水掛け+アイスマッサージ",
                "15℃の水道水を全身にかけ続ける","室温22℃で扇風機の風にあたる","(頸部・腋部・鼠径部)"]

# バーの色だけオリジナルで指定
ori_blue = "#71C0F9"

fig, ax = plt.subplots(figsize=(12, 6))

icing_method.plot.barh(legend=False, ax=ax, width=0.8,color=ori_blue)

# 1. タイトル設定
plt.title("冷却方法と冷却スピード",fontsize=24,fontweight='bold',color="dimgray")

# 2. 左に余白を多めに作る
plt.subplots_adjust(left=0.35)

# 3. y軸の順番を逆に
ax.invert_yaxis()

# 4. 左枠以外を消す
sides = ['right', 'top', 'bottom']
[ax.spines[side].set_visible(False) for side in sides]

# 5. y軸x軸のtick, y軸のtick labelを消す
ax.tick_params(bottom=False, left=False,labelleft=False)

# 6. x軸値ラベルの設定
ax.set_xticks([i*0.1 for i in range(5)])
ax.tick_params(axis='x', labelcolor="silver")

# 7. x軸の範囲設定(0.4までにするとx=0.4のグリッドが出てこないため)
ax.set_xlim(0,0.41)

# 8. x軸グリッドの設定
ax.grid(axis="x")

# 9. x軸のラベル設定
ax.set_xlabel("10秒あたりに下がる体温(℃)",fontsize="x-large",fontweight="bold",color="silver")

# 10. バーの右側に実際の値、右側に項目と補足説明を表示
vmax = icing_method['冷却スピード'].max()
for i, (value,main_label,sub_label) in enumerate(zip(icing_method['冷却スピード'],icing_method.index,icing_detail)):
    ax.text(value+vmax*0.02, i, f'{value:,} ℃', fontsize='x-large', va='center', color=ori_blue)
    ax.text(-0.01, i-0.1,main_label  , fontsize='xx-large', va='center',ha='right',color="dimgray")
    ax.text(-0.01,i+0.25, sub_label, fontsize='x-large' ,va='center',ha='right', color="silver")
- 項目と補足説明のように、同じtext内でフォントサイズを変えることが出来ないので、別々に分けて表示している
