概要
購買データをもとに顧客のクラスター分析を行いました。クラスター分析を行った後、各々のセグメントがどういった特徴を持つのかを可視化しました。
はじめに
機械学習を行う際には、多くの場面でデータ分析が必要となってきます。持っているデータをどんな切り口で見ていくか、またどんなふうに加工を施すか。
そういった引き出しを増やしていきたいところですが、Pythonを使ってのデータ分析教材はあまり多くないのが現状です。(アヤメやタイタニックの話は飽きたよぉ…)
そこで「Pthonじゃなくても、データ分析の手法を学べる教材を買って、それを自分なりにPythonで再現すれば引き出しを増やせるんじゃない?」と考えました。
今回手にした本は下記となります。
Rビジネス統計分析 [ビジテク]
【本書の目的】
本書は、ビジネスの現場に蓄積する大量のデータから、Rを用いて
自社の売り上げに直結するビックXを求めるビジネス統計分析手法を
まとめた書籍です。概論と実際の分析手法をセットにして、わかりやすく
解説しています。
使用データ
上記、書籍のファイルを使用させていただきました。
・購買履歴情報 [buying.csv]
実際のコード
1.データの読み込み
# ライブラリのインポート
import numpy as np
import pandas as pd
import matplotlib.pyplot as plt
import seaborn as sns
import japanize_matplotlib
%matplotlib inline
# ファイルの読み込み・表示
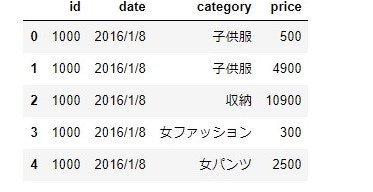
buying = pd.read_csv("buying.csv",encoding='cp932')
buying.head()
2.クロス集計を行う
# クロス集計による併売データを作成する
buying_mat = pd.crosstab(buying['id'], buying['category'])
buying_mat.head()
3.ダミー変数化したうえで階層クラスター分析
# 併売データをダミー変数化する
# 1回以上購入していれば「1」、それ以外なら「0」とする
buying_mat1 = buying_mat.copy()
for i in range(len(buying_mat1)):
    for j in range(len(buying_mat1.columns)):
        if buying_mat1.iloc[i, j] > 1:
            buying_mat1.iloc[i, j] = 1

buying_mat1.head()
# クラスター分析のライブラリのインポート
from scipy.cluster.hierarchy import dendrogram, linkage
from scipy.cluster.hierarchy import linkage, dendrogram, fcluster
# 階層型クラスタリングの実施
# ウォード法 x ユークリッド距離
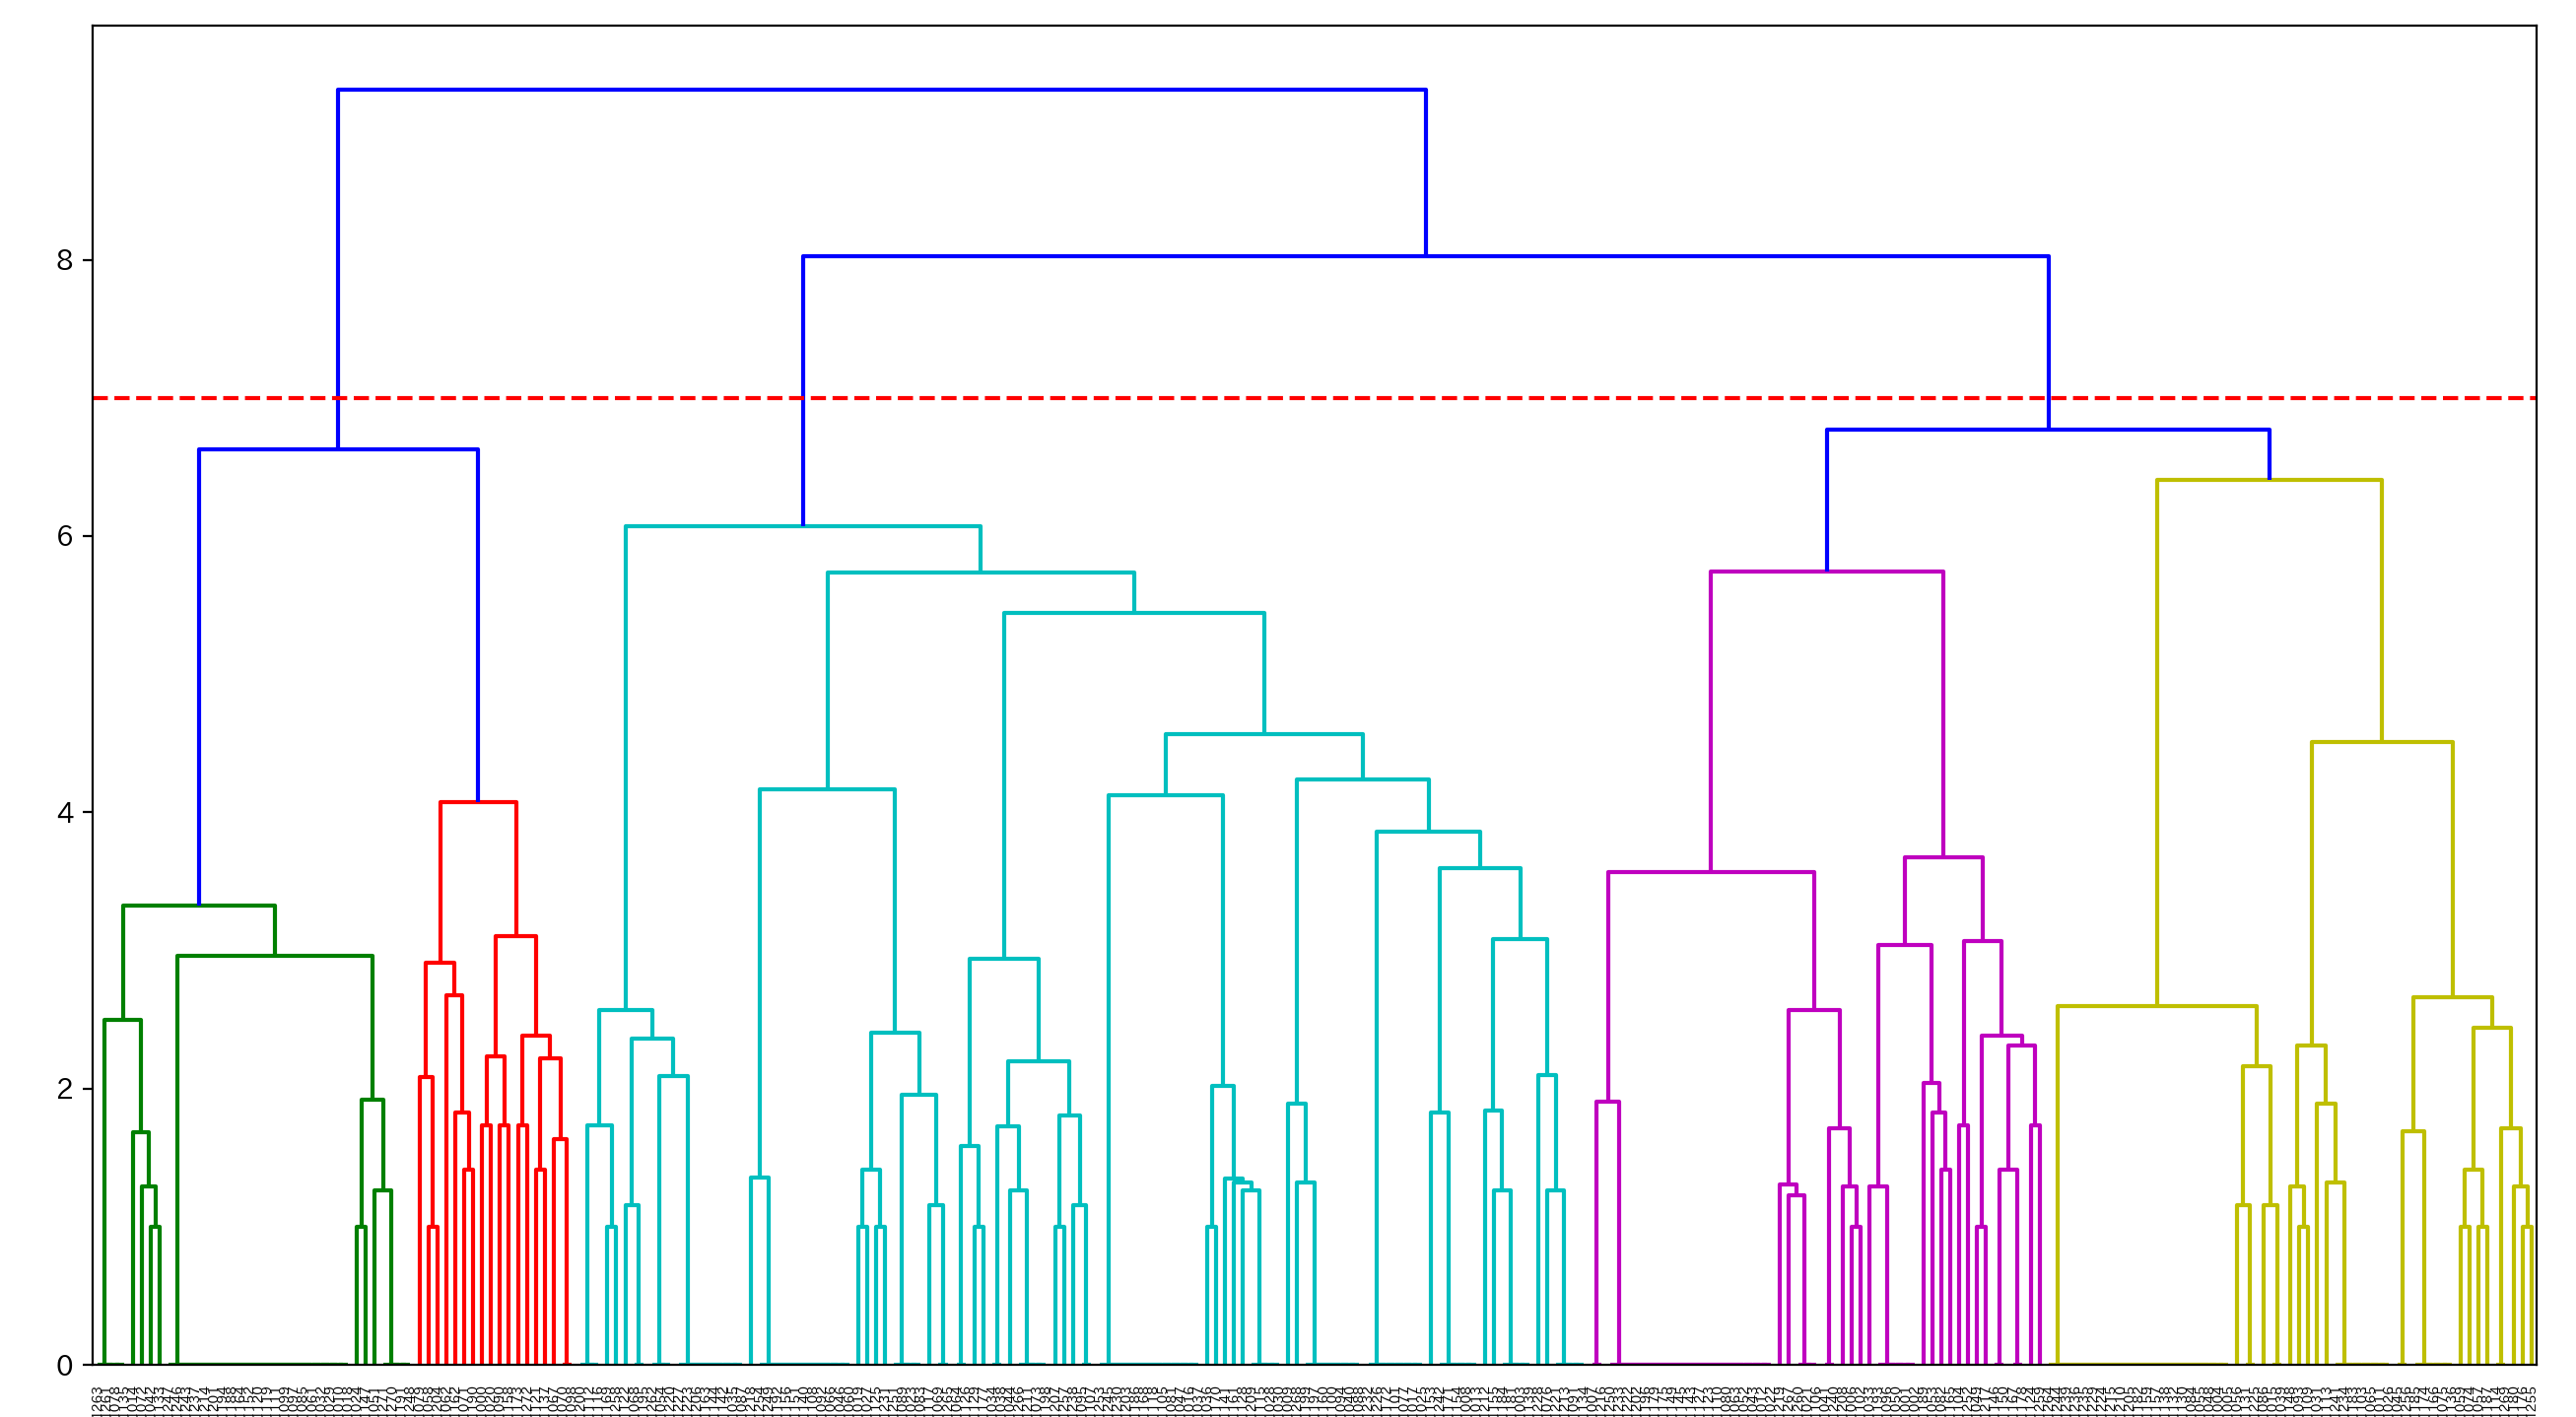
linkage_result = linkage(buying_mat1, method='ward', metric='euclidean')
# クラスター分けするしきい値を決める
threshold = 0.7 * np.max(linkage_result[:, 2])
# 階層型クラスタリングの可視化
plt.figure(num=None, figsize=(16, 9), dpi=200, facecolor='w', edgecolor='k')
dendrogram(linkage_result, labels=buying_mat1.index, color_threshold=threshold)
plt.axhline(7, linestyle='--', color='r')
plt.show()
# クラスタリング結果の値を取得
clustered = fcluster(linkage_result, threshold, criterion='distance')
# クラスタリング結果を確認
print(clustered)
4.ダミー変数化しない場合の階層クラスター分析
# 階層型クラスタリングの実施
# ウォード法 x ユークリッド距離
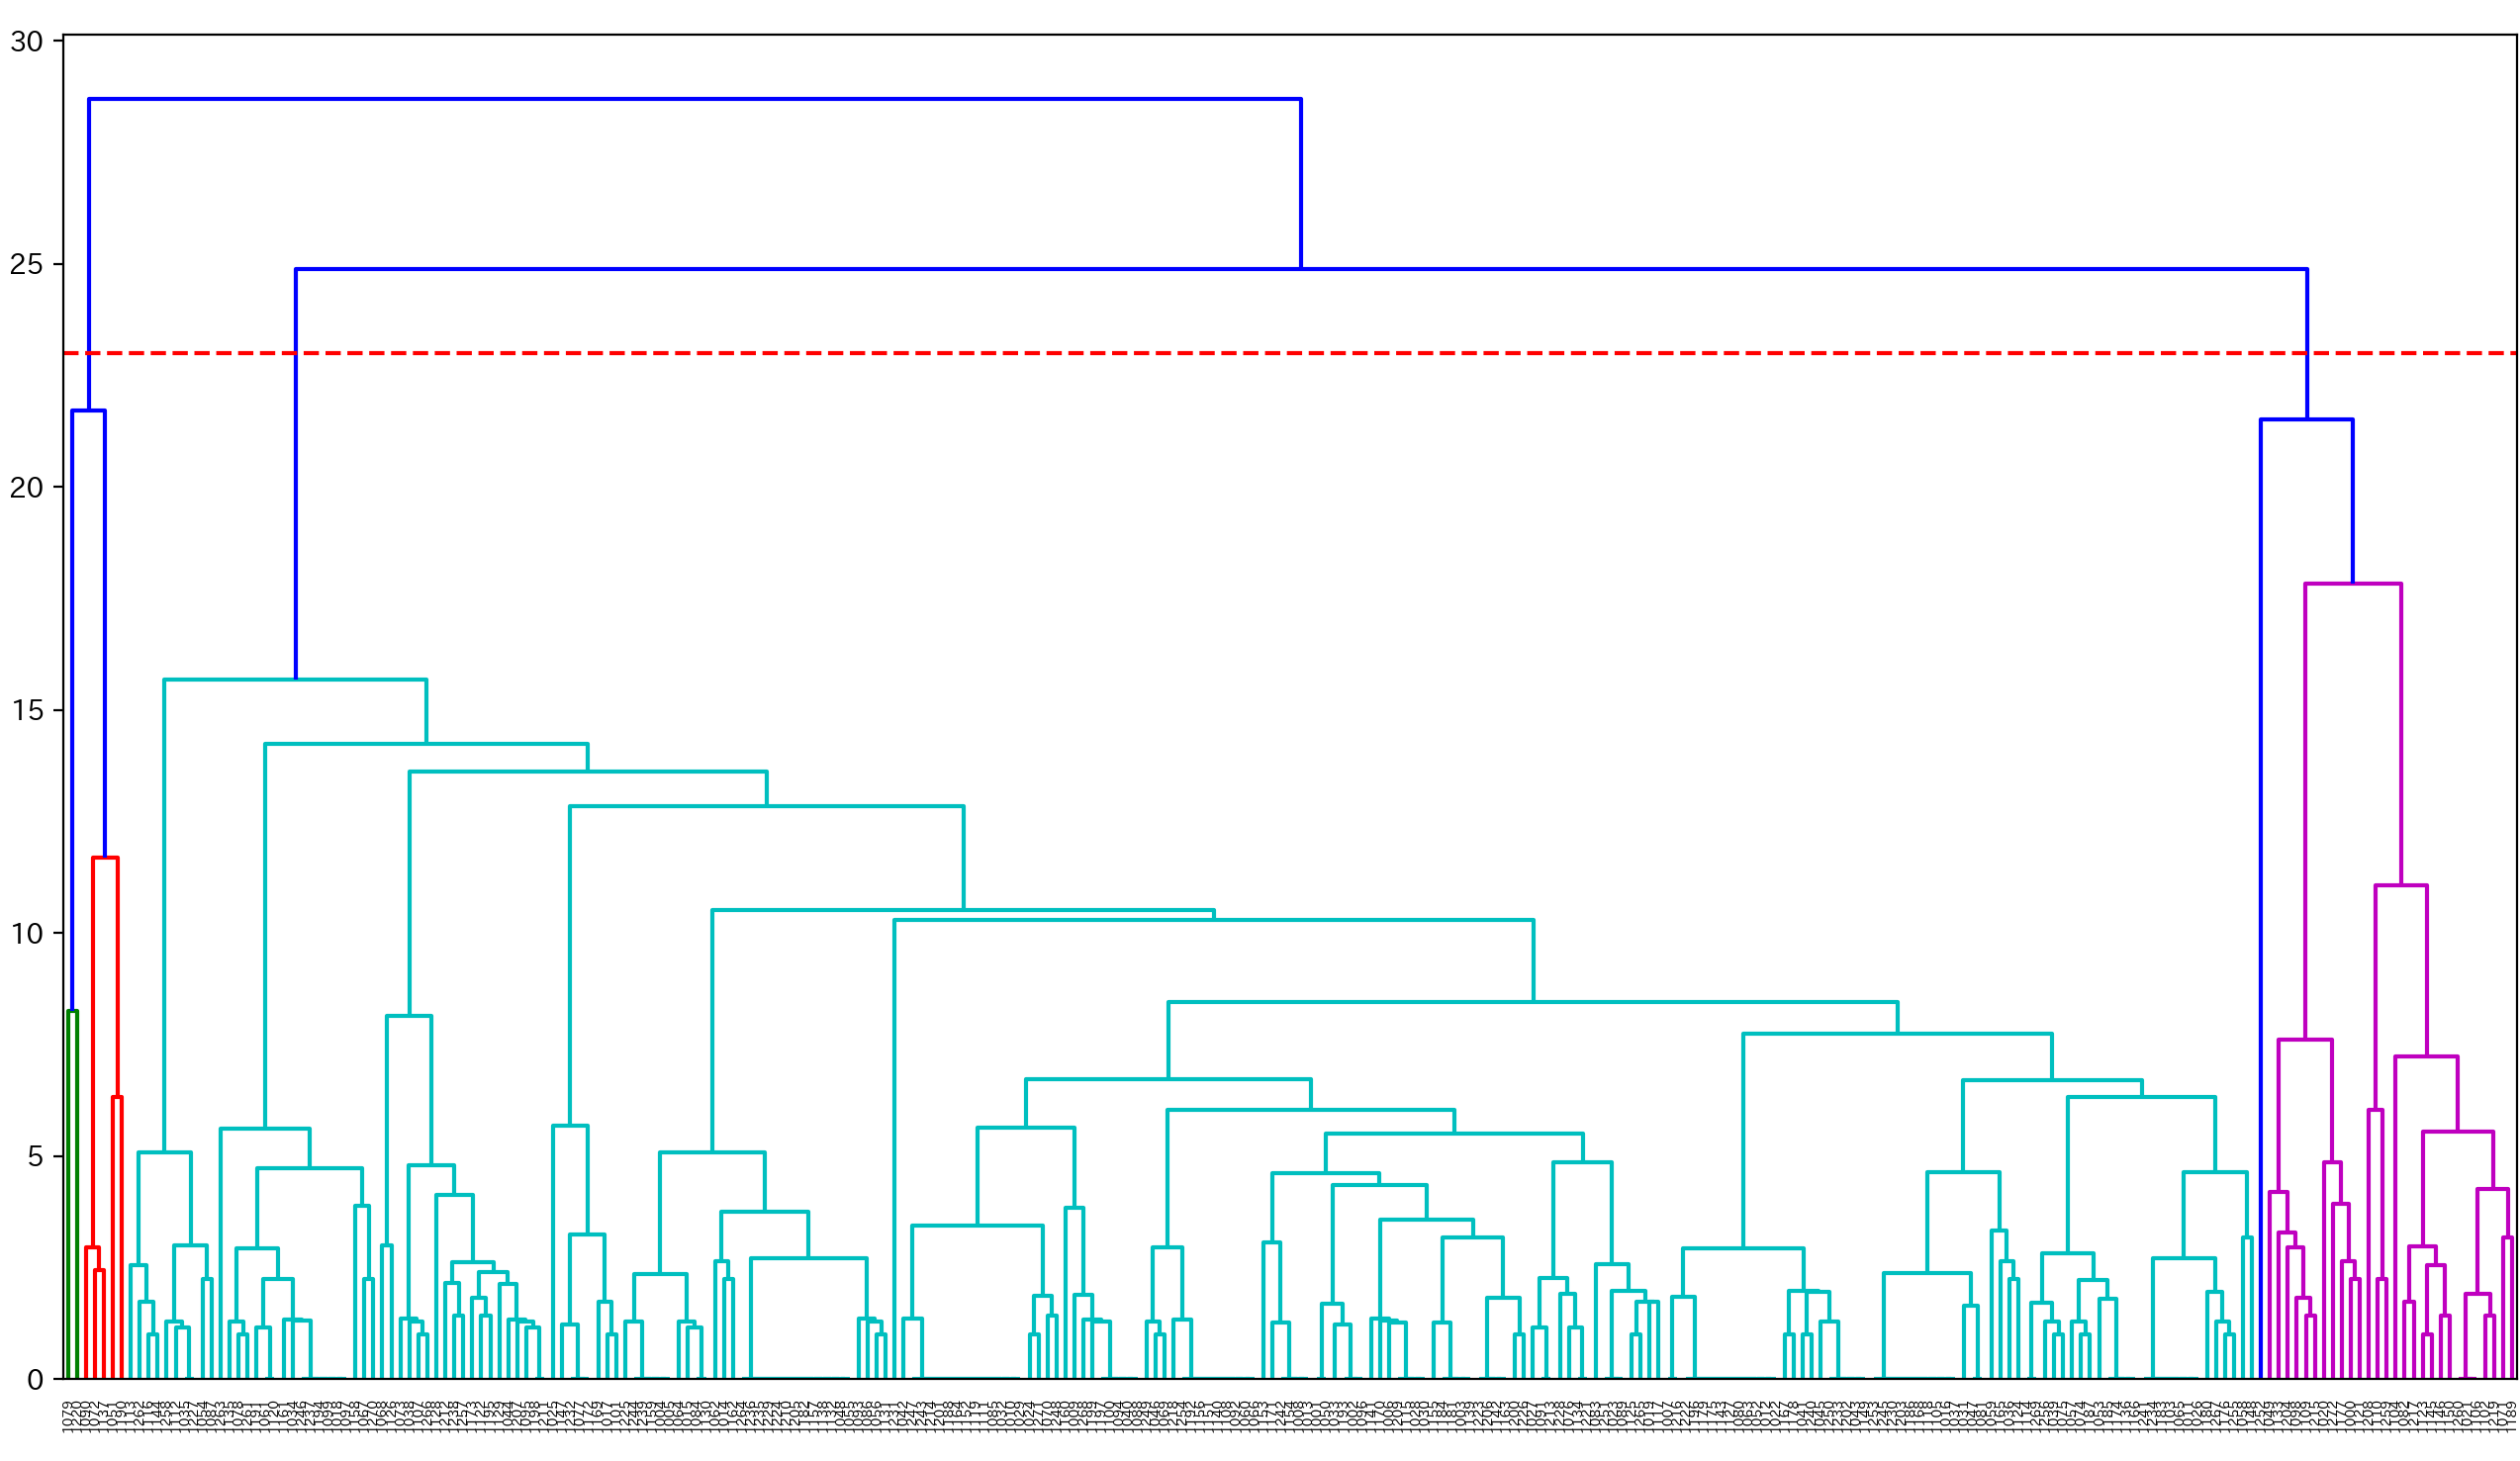
linkage_result2 = linkage(buying_mat, method='ward', metric='euclidean')
# クラスター分けするしきい値を決める
threshold2 = 0.7 * np.max(linkage_result2[:, 2])
# 階層型クラスタリングの可視化
plt.figure(num=None, figsize=(16, 9), dpi=200, facecolor='w', edgecolor='k')
dendrogram(linkage_result2, labels=buying_mat.index, color_threshold=threshold2)
plt.axhline(23, linestyle='--', color='r')
plt.show()
5.階層クラスター分析の結果を元データと結合する
# 階層クラスター分析の結果をDataFrame化
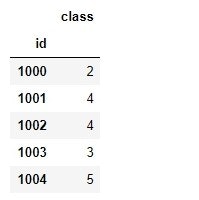
_class = pd.DataFrame({'class':clustered}, index= buying_mat1.index)
_class.head()
# 元データと分析結果を結合
buying_mat2 = pd.concat([buying_mat1, _class] ,axis=1)
buying_mat2.head()
# 各セグメントの顧客数を確認
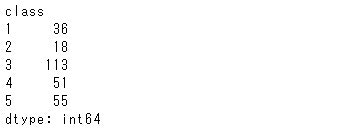
buying_mat2.groupby('class').size()
6.各セグメントにおける併売傾向の特徴をつかむ
# セグメントごとにすべての商品カテゴリの平均値を算出
cluster_stats = np.round(buying_mat2.groupby('class', as_index=False).mean() ,2)
cluster_stats.head()
# グラフ描画のために、縦長のデータ形式に変換
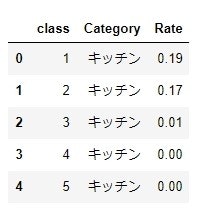
mat_melt = pd.melt(cluster_stats, id_vars='class', var_name='Category',value_name='Rate')
mat_melt.head()
# セグメントの特徴をグラフにする
fig = plt.figure(figsize =(20,8))
ax1 = fig.add_subplot(1, 5, 1)
sns.barplot(x='Category', y='Rate', data=mat_melt[mat_melt['class'] == 1], ax=ax1)
plt.xticks(rotation=90)
plt.ylim(0, 1)

ax2 = fig.add_subplot(1, 5, 2)
sns.barplot(x='Category', y='Rate', data=mat_melt[mat_melt['class'] == 2], ax=ax2)
plt.xticks(rotation=90)
plt.ylim(0, 1)

ax3 = fig.add_subplot(1, 5, 3)
sns.barplot(x='Category', y='Rate', data=mat_melt[mat_melt['class'] == 3], ax=ax3)
plt.xticks(rotation=90)
plt.ylim(0, 1)

ax4 = fig.add_subplot(1, 5, 4)
sns.barplot(x='Category', y='Rate', data=mat_melt[mat_melt['class'] == 4], ax=ax4)
plt.xticks(rotation=90)
plt.ylim(0, 1)

ax5 = fig.add_subplot(1, 5, 5)
sns.barplot(x='Category', y='Rate', data=mat_melt[mat_melt['class'] == 5], ax=ax5)
plt.xticks(rotation=90)
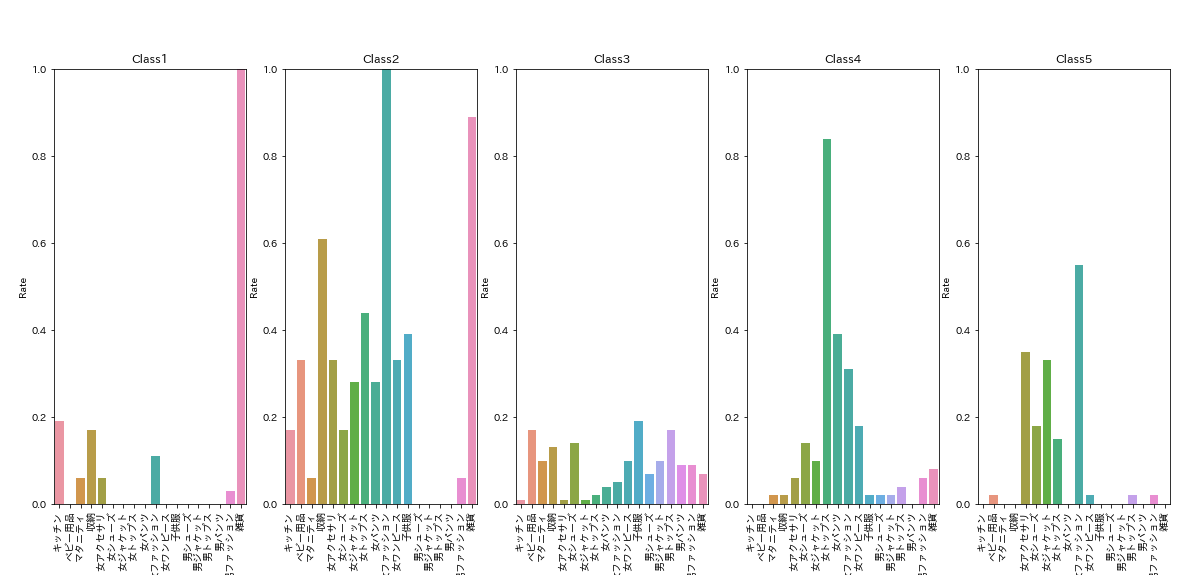
# セグメントの特徴をグラフにする(for文でグラフ描画)
groups = mat_melt.groupby('class')
fig = plt.figure(figsize =(20,8))

for name, group in groups:
    _ax = fig.add_subplot(1, 5, int(name))
    sns.barplot(x='Category', y='Rate', data=group , ax=_ax)
    plt.title('Class' + str(name))
    plt.xticks(rotation=90)
    plt.ylim(0, 1)
各セグメントの特徴から購入層を推定してみる。
・Class1
・雑貨の購入率が高い
⇒雑貨好きの層?
・Class2
・男性物を除いた項目の購入率がまんべんなく高い
⇒子供のいる家庭・女性客?
・Class3
・ベビー用品、マタニティ、男性物と購入率が高い
⇒子供のいる家庭・男性客?
・Class4
・女性物の購入率が高い
⇒女性客?
・Class5
・女性物の購入率が高い、ただしClass4とは購買傾向が異なる
⇒女性客(Class4とは購買傾向が異なる)?
