概要
raspberry pi 1でtensorflow liteやってみた。
tfliteファイルを作ってみた。
kerasモデルから作ってみた。
データセットは、sin.
環境
tensorflow 1.12
データセットを作る。
import numpy as np

x = np.linspace(-3.3, 3.4, 40)
y = np.sin(x)
data = np.c_[x, y]
np.savetxt('sin.csv', data, delimiter = ',', header = "x,y")
print ("ok")
kerasモデルを学習してセーブする。
import numpy as np
from tensorflow.contrib.keras.api.keras.models import Sequential
from tensorflow.contrib.keras.api.keras.layers import Dense, Activation
from tensorflow.contrib.keras.api.keras.optimizers import SGD, Adam
import matplotlib.pyplot as plt

data = np.loadtxt('sin.csv', delimiter = ',', unpack = True)
x = data[0]
y = data[1]
model = Sequential()
model.add(Dense(30, input_shape = (1, )))
model.add(Activation('sigmoid'))
model.add(Dense(40))
model.add(Activation('sigmoid'))
model.add(Dense(1))
sgd = Adam(lr = 0.1)
model.compile(loss = 'mean_squared_error', optimizer = sgd)
model.fit(x, y, epochs = 1000, batch_size = 20, verbose = 0)
print ('save model')
model.save('sin_model.h5')
predictions = model.predict(x)
print (np.mean(np.square(predictions - y)))
preds = model.predict(x)
plt.plot(x, y, 'b', x, preds, 'r--')
plt.show()
kerasファイルからtfliteファイルを作る。
import tensorflow as tf
import tensorflow.contrib.lite as lite

converter = lite.TFLiteConverter.from_keras_model_file("sin_model.h5")
tflite_model = converter.convert()
open("sin_model.tflite", "wb").write(tflite_model)
print ("ok")
tfliteファイルを検証する。
import numpy as np
import tensorflow as tf
import tensorflow.contrib.lite as lite
import matplotlib.pyplot as plt
data = np.loadtxt('sin.csv', delimiter = ',', unpack = True)
x = data[0]
y = data[1]
interpreter = lite.Interpreter(model_path = "sin_model.tflite")
interpreter.allocate_tensors()
input_details = interpreter.get_input_details()
output_details = interpreter.get_output_details()
input_shape = input_details[0]['shape']
pred = []
for i in x:
input_data = np.array([[i]], dtype = np.float32)
interpreter.set_tensor(input_details[0]['index'], input_data)
interpreter.invoke()
output_data = interpreter.get_tensor(output_details[0]['index'])
pred.append(output_data[0][0])
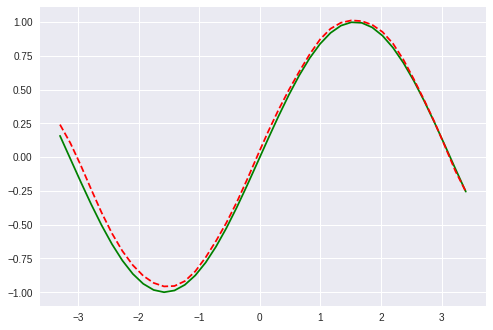
plt.plot(x, y, 'g', x, pred, 'r--')
plt.show()
以上。