概要
windows11に、sketchup6を入れてみた。
rubyで、3Dを書く。
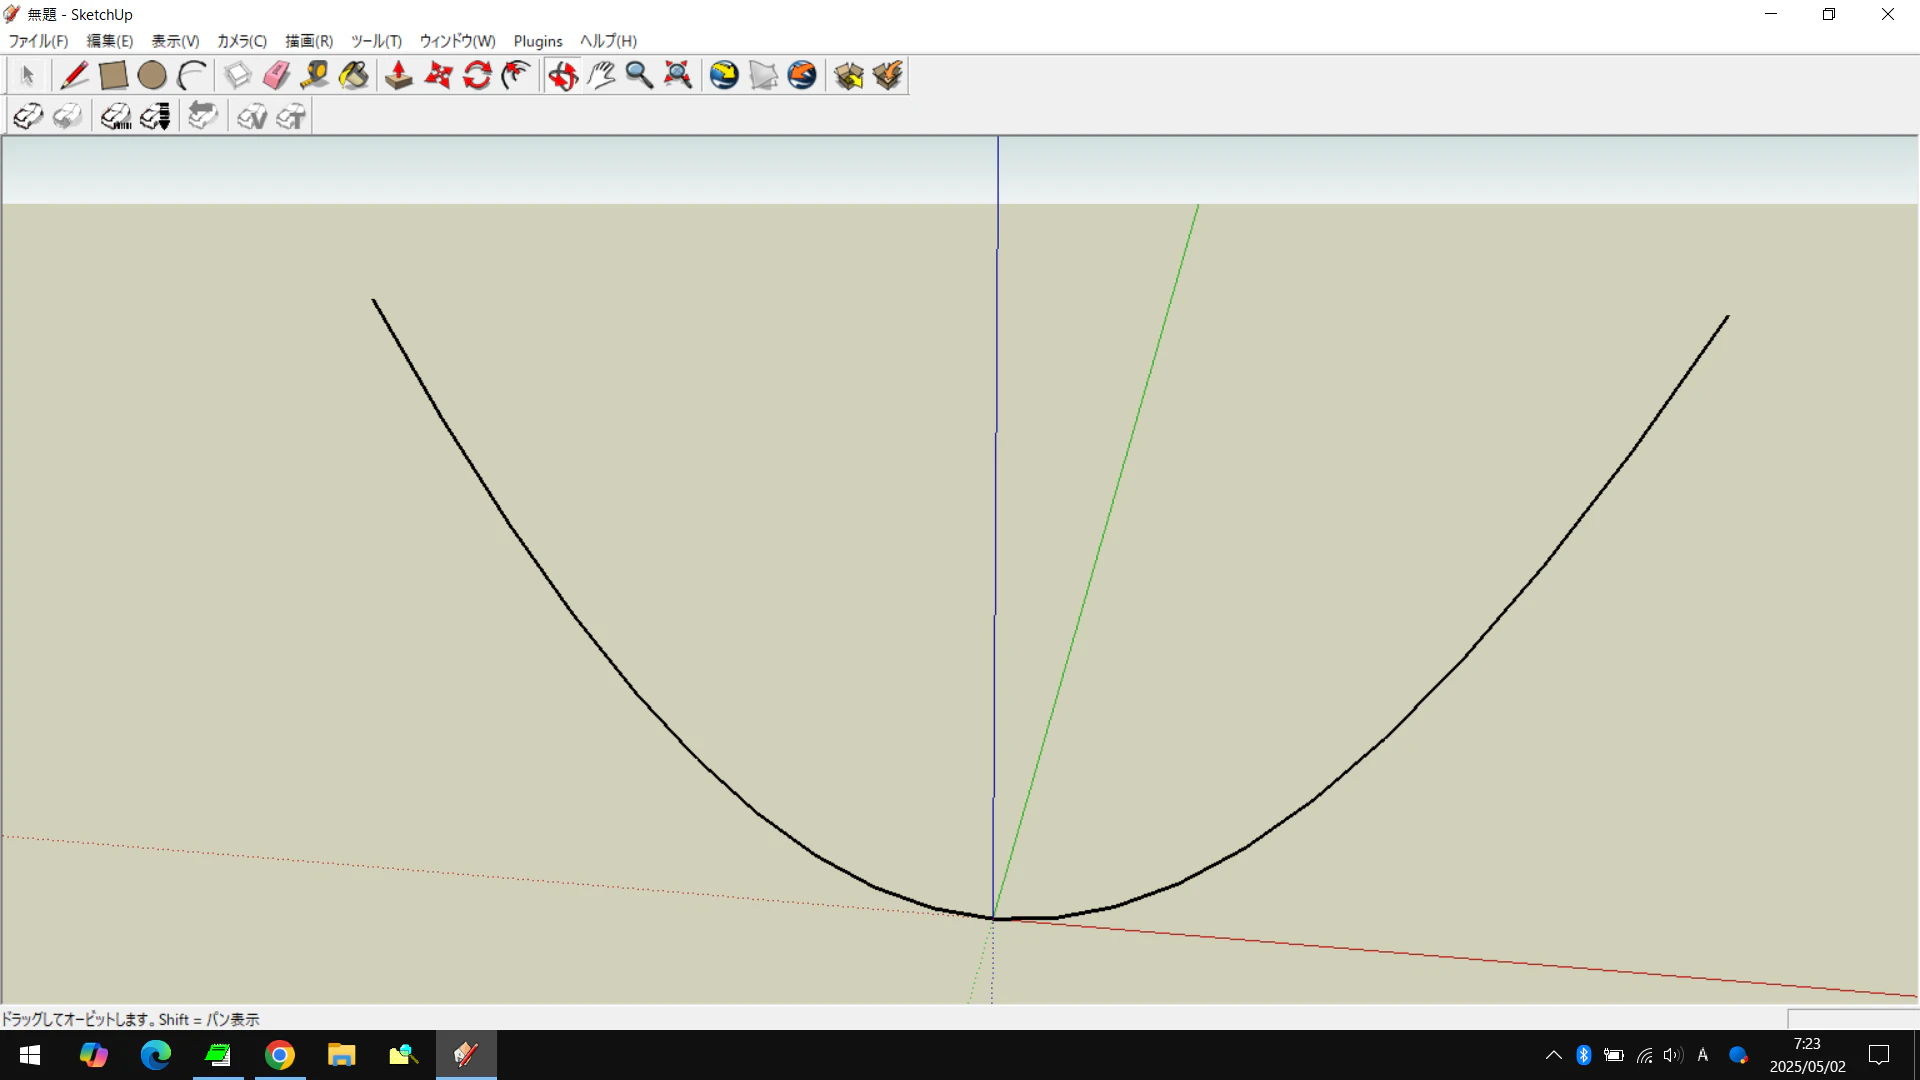
式を評価して、グラフを描く、スクリプト見つけたのでやってみた。
写真
サンプルコード
def graph_2d
	model = Sketchup.active_model
	model.start_operation "k_tools"
	entities = model.active_entities
	group = entities.add_group
	entities = group.entities
	$plasel = "xy" if not $plasel
	plane_list = %w[xy xz yz].join("|")
	dropdowns = [plane_list]
	prompts = ["Graphe dans le plan: "]
	values = [$plasel]
	results = inputbox prompts, values, dropdowns, "Selection du Plan"
	$plasel = results[0].chomp
	if $plasel == "xy" then
		Sketchup::set_status_text("Dessiner le graphique dans le plan XY", SB_PROMPT)
		xbeg = -1.0 if not xbeg
		xend = 1.0 if not xend
		stepw = 0.1 if not stepw
		prompts = ["Valeur X mini ", "Valeur X maxi ", "Valeur du pas "]
		values = [xbeg, xend, stepw]
		results = inputbox prompts, values, "Intervalle et resolution"
		xbeg, xend, stepw = results
		formula = "x**2" if not formula
		prompts = ["y = "]
		values = [formula]
		results = inputbox prompts, values, "Formule mathematique"
		formula = results.to_s
		xbeg.step(xend - stepw, stepw) do |i|
			x1 = i
			x = x1
			z1 = 0
			begin
				y1 = eval(formula)
			rescue
				y1 = 0
			end
			y1 = 100000000 if y1 > 100000000
			y1 = -100000000 if y1 < -100000000
			x2 = i + stepw
			x = x2
			z2 = 0
			begin
				y2 = eval(formula)
			rescue
				y2 = 0
			end
			y2 = 100000000 if y2 > 100000000
			y2 = -100000000 if y2 < -100000000
			pt1 = [x1.m, y1.m, z1.m]
			pt2 = [x2.m, y2.m, z2.m]
			polyline2d = entities.add_line(pt1, pt2)
		end
	elsif $plasel == "xz" then
		Sketchup::set_status_text("Dessiner le graphique dans le plan XZ", SB_PROMPT)
		xbeg = -1.0 if not xbeg
		xend = 1.0 if not xend
		stepw = 0.1 if not stepw
		prompts = ["Valeur X mini ", "Valeur X maxi ", "Valeur du pas "]
		values = [xbeg, xend, stepw]
		results = inputbox prompts, values, "Intervalle et resolution"
		xbeg, xend, stepw = results
		formula = "x**2" if not formula
		prompts = ["z = "]
		values = [formula]
		results = inputbox prompts, values, "Formule mathematique"
		formula = results.to_s
		xbeg.step(xend - stepw, stepw) do |i|
			x1 = i
			x = x1
			y1 = 0
			begin
				z1 = eval(formula)
			rescue
				z1 = 0
			end
			z1 = 100000000 if z1 > 100000000
			z1 = -100000000 if z1 < -100000000
			x2 = i + stepw
			x = x2
			y2 = 0
			begin
				z2 = eval(formula)
			rescue
				z2 = 0
			end
			z2 = 100000000 if z2 > 100000000
			z2 = -100000000 if z2 < -100000000
			pt1 = [x1.m, y1.m, z1.m]
			pt2 = [x2.m, y2.m, z2.m]
			polyline2d = entities.add_line(pt1, pt2)
		end
	elsif $plasel == "yz" then
		Sketchup::set_status_text("Dessiner le graphique dans le plan YZ", SB_PROMPT)
		xbeg = -1.0 if not xbeg
		xend = 1.0 if not xend
		stepw = 0.1 if not stepw
		prompts = ["Valeur Y mini ", "Valeur Y maxi ", "Valeur du pas "]
		values = [xbeg, xend, stepw]
		results = inputbox prompts, values, "Intervalle et resolution"
		xbeg, xend, stepw = results
		formula = "y**2" if not formula
		prompts = ["z = "]
		values = [formula]
		results = inputbox prompts, values, "Formule mathematique"
		formula = results.to_s
		xbeg.step(xend - stepw, stepw) do |i|
			y1 = i
			y = y1
			x1 = 0
			begin
				z1 = eval(formula)
			rescue
				z1 = 0
			end
			z1 = 100000000 if z1 > 100000000
			z1 = -100000000 if z1 < -100000000
			y2 = i + stepw
			y = y2
			x2 = 0
			begin
				z2 = eval(formula)
			rescue
				z2 = 0
			end
			z2 = 100000000 if z2 > 100000000
			z2 = -100000000 if z2 < -100000000
			pt1 = [x1.m, y1.m, z1.m]
			pt2 = [x2.m, y2.m, z2.m]
			polyline2d = entities.add_line(pt1, pt2)
		end
	end
	view = model.active_view.zoom_extents
	model.commit_operation
end
以上。