概要
PythonでFM変調、復調してみた。
復調アルゴリズムは、googleラジオ
写真
サンプルコード
import scipy.signal as sg
import numpy as np
import matplotlib.pyplot as plt
sample_rate = 48000.0
nsamples = 320
F_1 = 440.0
F_2 = 10000.0
F_3 = 10000.0
nyq_rate = sample_rate / 2.0
cutoff_hz = 5000.0
numtaps = 29
t = np.arange(nsamples) / sample_rate
vin = np.sin(2 * np.pi * F_1 * t)
vfm = np.sin(2 * np.pi * F_2 * t + 6.0 * -np.cos(2 * np.pi * F_1 * t))
i1 = vfm * np.cos(2 * np.pi * F_3 * t)
q1 = vfm * np.sin(2 * np.pi * F_3 * t)
lpf = sg.firwin(numtaps, cutoff_hz / nyq_rate)
I2 = sg.lfilter(lpf, 1, i1)
Q2 = sg.lfilter(lpf, 1, q1)
pI = 0
pQ = 0
m = 0
vo = np.zeros(320)
for t in range(0, vfm.size):
real = pI * I2[t] + pQ * Q2[t]
imag = pI * Q2[t] - pQ * I2[t]
sgn = 1
circ = 0
ang = 0
div = 1
if (real < 0):
sgn = -sgn
real = -real
circ = np.pi
if (imag < 0):
sgn = -sgn
imag = -imag
circ = -circ
if (real > imag):
div = imag / real
else:
if (real != imag):
ang = -np.pi / 2
div = real / imag
sgn = -sgn
vo[t] = circ + sgn * (ang + div / (0.98419158358617365 + div * (0.093485702629671305 + div * 0.19556307900617517))) * 5
pI = I2[t]
pQ = Q2[t]
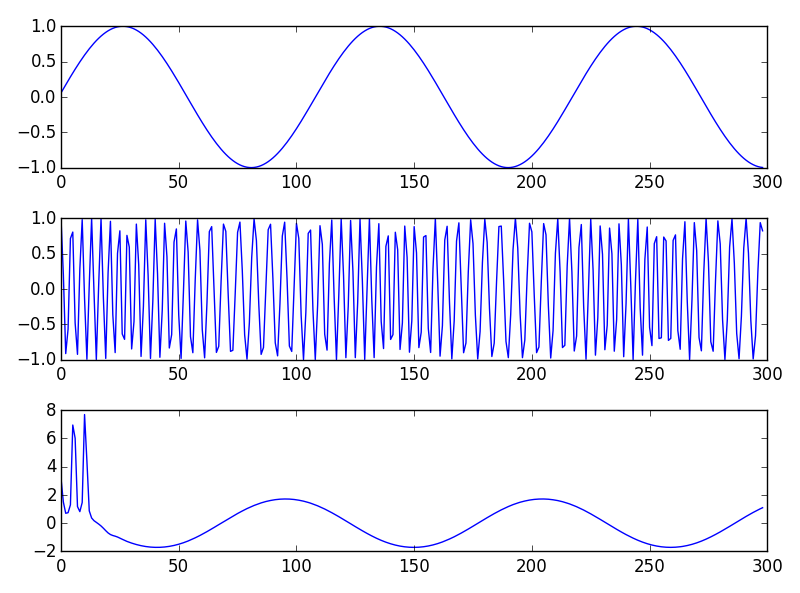
fig = plt.figure(1)
ax = fig.add_subplot(311)
ax.plot(vin[1:300])
ax = fig.add_subplot(312)
ax.plot(vfm[1:300])
ax = fig.add_subplot(313)
ax.plot(vo[1:300])
fig.set_tight_layout(True)
plt.show()